Managing Stormwater in New England with Low Impact Development

10 Best Low Impact Development Stormwater Practices

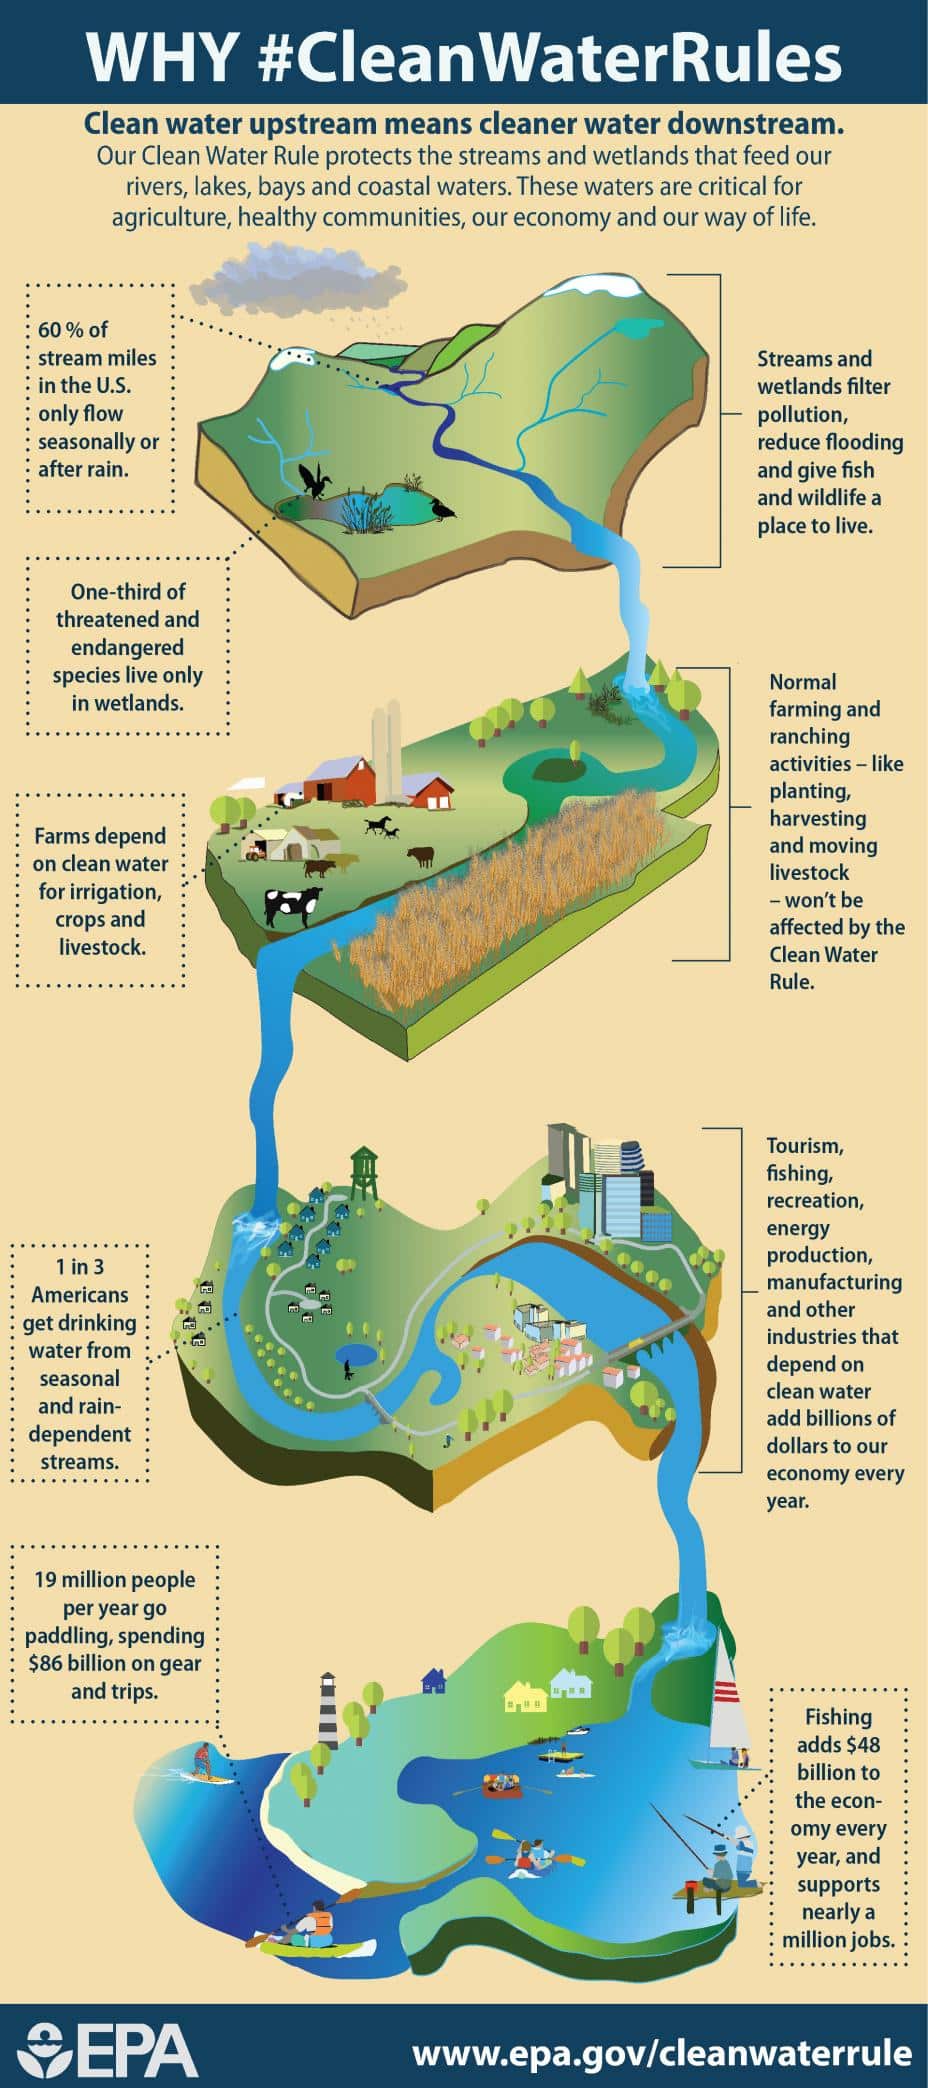
Stormwater runoff is the number one source of water pollution in the country, and a major threat to clean water in many New England communities. Over the years, we have paved, constructed, and developed the land to the point that the natural landscape is decimated. Where snow, sleet, and rain would normally land on forests and grass and be filtered by layers of dirt and rock, it now washes off parking lots, roads, driveways, rooftops, and other hard surfaces, known as impervious cover, and picks up pollutants such as oil, trash, sediment, bacteria, fertilizer, oil, and road salt along the way. This heavily polluted, untreated water then makes its way into streets and storm drains and subsequently into rivers and lakes that supply our drinking water.

In Texas and Oklahoma this week, we’ve seen the devastating and deadly effects of stormwater runoff. Because the absorbent grasses and dirt have been mostly covered over by pavement and buildings, heavy rains now run off streets, roofs, and driveways, overwhelming drainage systems and, in extreme weather, flooding homes. And in New England, stormwater runoff has not only contributed to water pollution and flash flooding, but also to beach closures, algae blooms, and soil erosion.

What is Low Impact Development?

Low Impact Development (LID), also known as green infrastructure, is a stormwater management approach that maintains natural hydrology during site development. LID minimizes impervious surfaces and utilizes existing natural site features along with conservational controls to manage stormwater. In LID, stormwater is viewed as a resource rather than a waste product, and the site is developed with this key concept in mind. Often, LID replaces traditional stormwater management practices that focus on moving stormwater off-site with curbs, pipes, and ditches.

LID is useful for creating functional, attractive, and environmentally friendly residential, commercial, and industrial sites, and is both sustainable and cost-effective. Some of the benefits include improved water and air quality, reduced stormwater runoff volume, increased natural habitat and recreational space, increased property values, improved groundwater recharge, and community beautification. Below we have compiled a list of ten LID stormwater practices that are most effective in managing stormwater in New England.
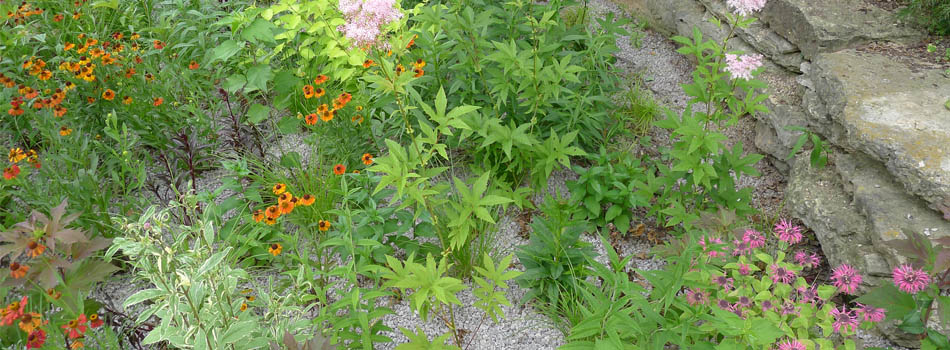
rain_garden_stormwater

1. Rain Gardens

A rain garden is typically situated close to the source of runoff and utilizes plants that are able to withstand extremes of moisture as well as excessive nutrients such as nitrogen and phosphorus. By slowing stormwater as it travels downhill, rain gardens provide opportunity for stormwater to infiltrate and also inhibit erosion. While rain gardens provide habitat for wildlife and are an attractive landscaping addition, it’s what’s beneath them that makes them an LID rain garden. Plants and soils are specifically chosen and engineered to clean stormwater by reducing nutrients and overall sediment loads. Multiple rain gardens are often spread over an area, cumulatively controlling the volume and improving the quality of stormwater runoff.
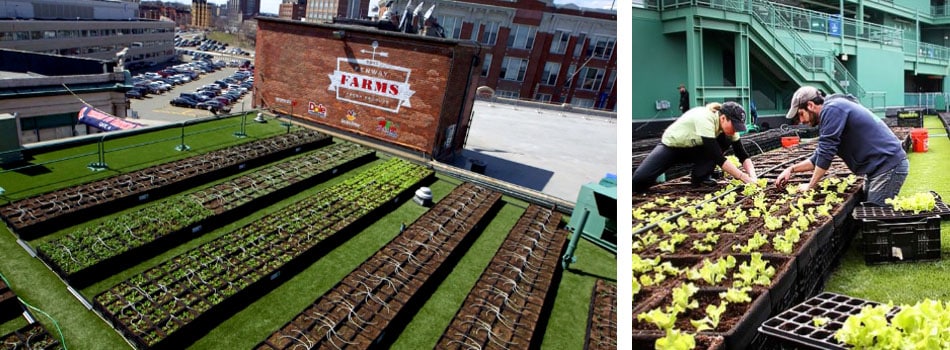
green_roof_fenway_park

2. Green Roofs 

A green roof, also knows as a rooftop garden, is exactly what its name suggests: a roof with vegetation on it. Through evapotranspiration, green roofs remove heat from the surface of the roof and in turn the surrounding air. A green roof is easily installed on any type of building, residential or commercial, and can be as simple as a single layer of groundcover or as intricate as Fenway Park’s extensive vegetable garden. In addition to providing excellent stormwater management and improving water quality, green roofs also provide such benefits as reduced energy use and air pollution, and improved comfort and quality of life.

permeable_pavement_stormwater

3. Permeable Pavement

The link between high levels of impervious surfaces and degraded water quality is indisputable, and most impervious surfaces are paved roadways. Reducing impervious surfaces is one of the key steps in improving any community’s water quality. Permeable, or pervious, pavement is designed to allow water to pass through it into the ground below where it is naturally filtered. Pervious pavement has a myriad of benefits including not only reduced stormwater runoff and replenished groundwater, but also reduction of flooding, pollutants, temperature, roadway ice buildup, and traffic hydroplaning accidents. In New England, special care needs to be taken when utilizing permeable pavement, as there is potential to compromise its effectiveness through plowing and sanding.
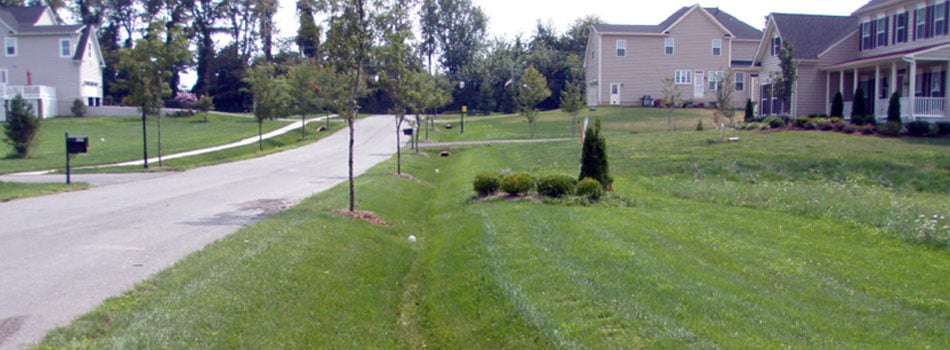
grassed_swale_stormwater

4. Grassed Swales

A grassed swale is an open channel designed to manage a specific water quality volume, often along roadsides and parking lots. Stormwater runoff is slowed by vegetation as it flows in these channels, allowing the stormwater to infiltrate and be filtered by the underlying soil. Grassed swales are long and shallow in shape and have plants that are both flood and erosion resistant.

grassed_swale_stormwater

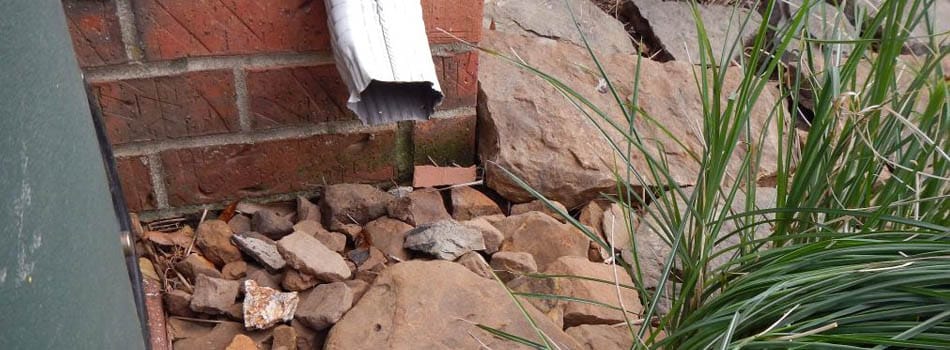
5. Disconnected Impervious Surface (DIS)

DIS is a low-cost, effective way of reducing the volume and flow of stormwater runoff by directing stormwater runoff from impervious areas to graded and vegetated pervious surfaces. DIS is effective for both roofs and paved areas utilizing slightly different designs and provides both infiltration and filtration.

bioretention_basin_stormwater

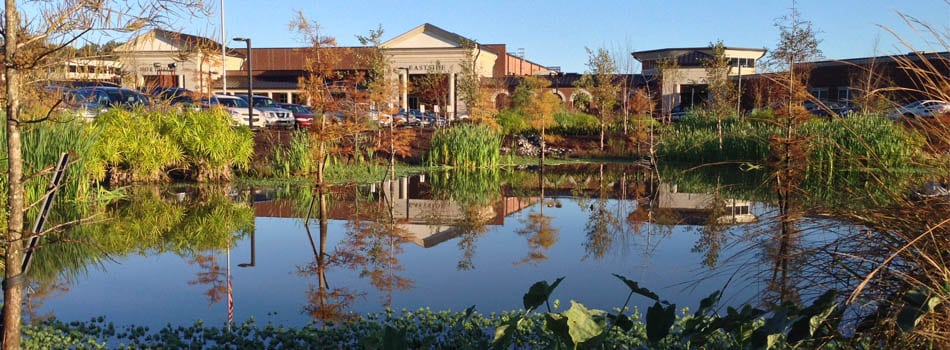
6. Bioretention Basins

Bioretention basins are landscaped depressions specifically designed to slow and treat on-site stormwater runoff. Typically utilized in parking lots and residential areas, these basins incorporate pollutant removal systems that naturally operate in forests. During a storm event, runoff pools above the mulch and is slowly filtered through the soil beneath before being collected by a perforated underdrain. The clean, filtered runoff is then returned to the storm drain system or local receiving waters.

green_streets_stormwater

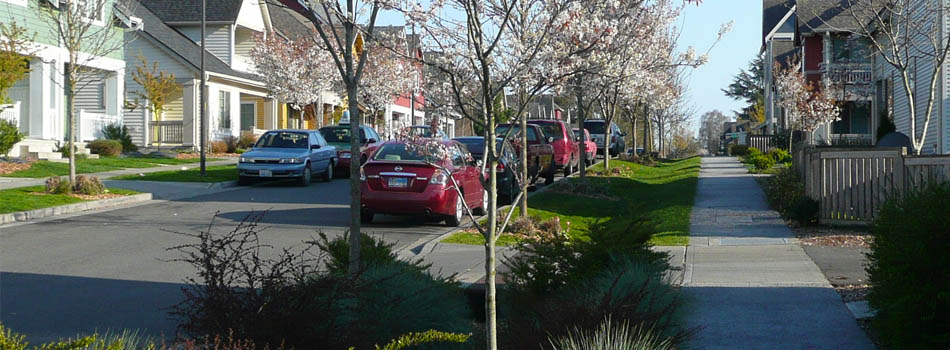
7. Alternative Street Design

Alternative street design is mainly effective for new construction and takes into account all aspects of “green streets.” When building a new street, all existing hydrologic functions of the land need to be considered and incorporated in the best possible way into the design. This includes preserving wetlands, buffers, and highly permeable soils while minimizing impervious areas. Typically streets are more narrowly constructed with wide, pervious sidewalks and plenty of vegetated areas.

stormwater bumpout

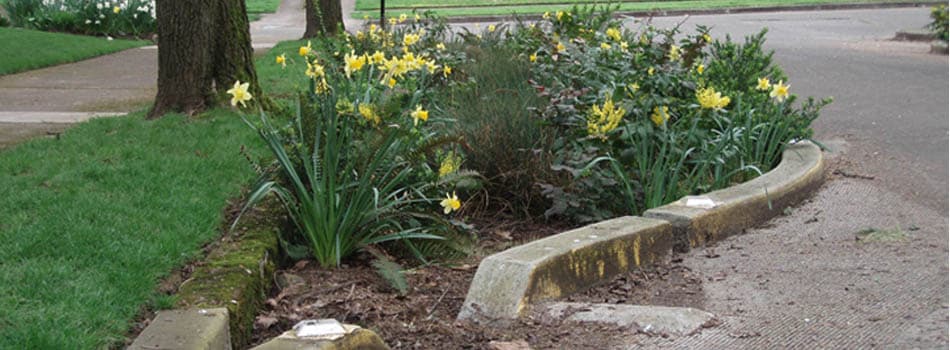
8. Bioretention Curb Extensions (Stormwater Bumpout)

A stormwater bumpout is a curb extension that extends the existing curb. Typically located either mid-block or at an intersection and composed of a layer of stone that is topped with flood and nutrient tolerant plants and soil, these attractive bumpouts filter stormwater while providing an aesthetic benefit to communities. The bumpout is constructed with an inlet (or curb-cut) that directs stormwater runoff into the bumpout where it can be infiltrated and filtered. The vegetation in a stormwater bumpout is short enough so as not to impact driver sight-lines.

stormwater planters

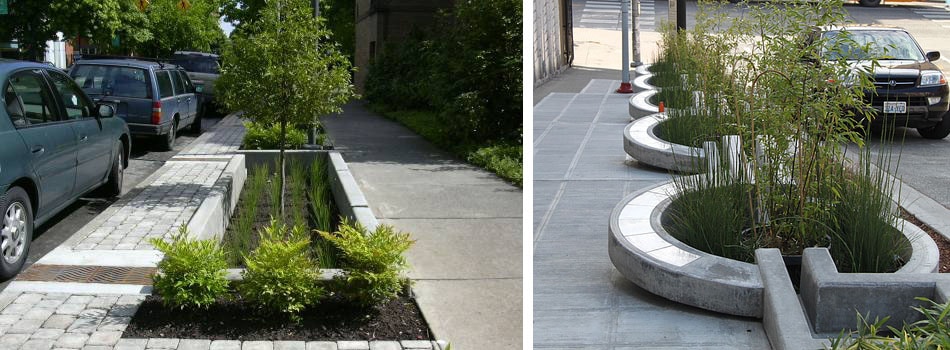
9. Stormwater Planters and Tree Boxes

Stormwater planters and tree boxes are installed in sidewalks and are designed to manage stormwater runoff from streets and sidewalks. Planters are typically sunken into the sidewalk, rectangular in shape with concrete sides, and lined with a permeable fabric. They are then filled with stone or gravel and topped with soil, hardy plants, and trees. Because they are built down into the sidewalk, runoff is directed into these planters that provide storage, infiltration, and evapotranspiration.

rain cistern stormwater

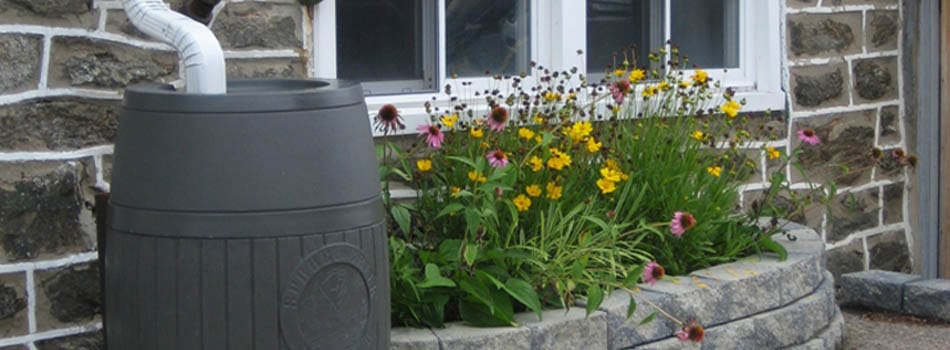
10. Rain Barrel/Cistern

A rain barrel collects and stores stormwater runoff from rooftops, where it can later be used to water lawns and gardens. To be effective, they must be emptied between storms and utilized by a high percentage of a community’s population. While one rain barrel holds a relatively small amount of water, a large volume of rain barrels can be extremely effective in significantly reducing the amount of stormwater entering a community’s sewer system during storms.

lid-stormwater.net
lakesuperiorstreams.org
nrdc.org
epa.org
lowimpactdevelopment.org
msrc.org
phillywatersheds.org

EPA Announces 2015 MSGP Available Soon, Advises Preparation

Photo by Roger Winstead

On May 27, 2015, the EPA announced that the new Multi-Sector General Permit (MSGP), originally proposed in 2013 and referred to as the 2015 MSGP, will be available soon for operators seeking permit coverage to discharge stormwater associated with industrial activity. Filing to renew coverage under the 2015 MSGP must be done electronically using EPA’s new NPDES eReporting Tool (NeT), and, once covered by the new permit, all monitoring data will be submitted electronically using NetDMR.

To prepare for the new 2015 MSGP, EPA recommends taking the following steps:

  1. Visit EPA’s MSGP webpage (https://water.epa.gov/polwaste/npdes/stormwater/EPA-Multi-Sector-General-Permit-MSGP.cfm) to learn about the status of the 2015 MSGP, your eligibility, NeT and NetDMR training, and to obtain guidance on complying with the new permit.
  2. Determine if your facility qualifies for a conditional “no exposure” permit exclusion.
  3. Review your Notice of Intent (“NOI”) submitted for coverge under the 2008 MSGP for information that will help you file a new NOI for the 2015 MSGP.
  4. Discuss internally who will prepare and certify the documents submitted through the NeT and NetDMR tools for your facility.
  5. Review your existing Stormwater Pollution Prevention Plan (SWPPP) to identify the revisions necessary to make it current and consistent with the 2015 MSGP requirements. Your SWPPP must be prepared and ready to implement prior to filing an NOI for the 2015 MSGP.

If you need assistance with your 2015 MSGP, please contact us at contact@tataandhoward.com or 800-366-5760.

White House Finalizes Clean Water Act Rule

clean water infographic
An infographic created by the EPA aims to clarify the rule

On May 27, 2015, the White House finalized the EPA’s “Waters of the United States” rule amid both praise and protest. According to the EPA, the rule is intended to strengthen the Clean Water Act by clarifying which bodies of water fall under the control of the Clean Water Act of 1972.

Gina McCarthy, Administrator of the U.S. EPA, praised the rule by saying, “The Clean Water Act has protected our health for more than 40 years – and helped our nation clean up hundreds of thousands of miles of polluted waterways…Using the latest science, this rule clears up the confusion, providing greater certainty for the first time in more than a decade about which waters are important to protect.”

And White House Senior Advisor Brian Deese, who announced the rule with EPA and Army Corps officials, had very strong words in favor of the rule: “There is a lot of misinformation about what this rule does and doesn’t do. But what becomes clear…is that the only people with reason to oppose the rule are polluters who knowingly threaten our clean water.”

However, the rule does have some strong opposition. Republicans and developers, along with the agricultural and oil industries, have vehemently opposed the ruling since its initial draft, saying that it is a massive power grab by Washington.

“The administration’s cavalier attitude toward expanding the federal government’s authority into our backyards is absolutely outrageous,” said Sen. David Vitter (R-La.) in a statement. “Not only were small businesses – who will be dramatically impacted by expanding of the definition of ‘waters of the United States’ – inappropriately excluded from the rule-making process, but the federal government shouldn’t be regulating puddles on private property in the first place.”

Although this is a final rule, there is legislation to block it that has passed the House and is waiting in the Senate.

Water Storage Tanks: Hydraulic Modeling and Water Quality Considerations

Abstract: A hydraulic model can be used for extended period simulations (EPS) and the EPS models can be used to determine water age in the distribution system. The Town of Paxton, Massachusetts was having some issues maintaining a chlorine residual so Tata & Howard completed a study looking at water age and chlorine residual, and developed recommendations to help them improve system water quality.

National Public Works Week 2015

national public works week 2015 posterThis week, May 17-23, is National Public Works Week 2015. It follows directly on the heels of National Infrastructure Week, which is appropriate considering that public works and infrastructure are intricately connected. During Infrastructure Week, we took a look at the dire needs of our water infrastructure, and the importance of investing in this critical system. This week we are focusing on all facets of infrastructure and public works, including the incredible people who make it all possible.

According to the American Public Works Association (APWA), public works is the combination of physical assets, management practices, policies, and personnel necessary for government to provide and sustain structures and services essential to the welfare and acceptable quality of life for its citizens. Public Works employees provide such necessary services as trash collection, road and bridge repairs, and water treatment and supply. Without the tireless efforts of these extraordinary people, both our quality of life and our nation’s economy would drastically decline. During blizzards, our public works employees are awake all night plowing the roadways in order to make them safe and passable. During hot summers, public works employees can be seen filling potholes and paving roadways. All year round, public works employees ensure that we have a steady supply of clean, safe drinking water while also ensuring that our trash and wastewater are swiftly and neatly carried away.

Let’s take a look at some impressive facts about our nation’s infrastructure and public works:

public works employee

  • Public works accounts for about 2.2 million jobs in the U.S.
  • Every American generates about 4.5 lbs. of municipal solid waste (MSW) per day; MSW, more commonly referred to as trash, consists of everyday items such as product packaging, grass clippings, furniture, clothing, bottles, food scraps, newspapers, appliances, paint, and batteries.
  • The U.S. has four million miles of public roads and 594,000 bridges.
  • Transportation-related goods and services contributed to 10% of U.S. GDP in 2006, which is roughly $1.4 billion.
  • Every $1 taxpayers invest in public transportation generates up to $6 in economic return.
  • 268 million Americans get their drinking water from a community water system.
  • Water utilities treat approximately 34 billion gallons of water per day.
  • Drinking water supply infrastructure in the U.S. consists of dams, reservoirs, well fields, pumping stations, aqueducts, water treatment plants, water storage, and 1.8 million miles of distribution lines.
  • Publicly owned wastewater treatment plants serve 189.7 million people and treat 32.1 billion gallons per day.
  • Sanitation infrastructure in the U.S. consists of sewage pumping stations, over 16,000 publicly owned wastewater treatment plants, and 1.2 million miles of sewers.

Clearly, public works and infrastructure contribute greatly to our economy and lifestyle. Unfortunately, our infrastructure, and therefore our public works, requires an infusion of revenue and significant updating in order to continue to function properly. Take a look at these concerning facts:

water main break NYC
Water main break in New York City
  1. Our infrastructure is teetering on the edge of a failing grade. America’s Society of Civil Engineers (ASCE) has given the U.S. a D+ grade for its infrastructure condition, with $3.6 trillion worth of repair and restructuring costs needed by 2020. The grade encompasses aviation, bridges, drinking water, dams, energy, hazardous waste, levees, ports, public parks, trails, roads, schools, solid waste removal, wastewater removal, and transit.
  2. One out of every nine bridges in the United States is at risk of structural failure.
  3. Almost a third of all roads in the United States are in need of major repairs.
  4. Our ports soon won’t be able to accommodate any new ships.
  5. Our airports are some of the most congested in the world and our runways cannot accommodate the steadily increasing demand for air travel and additional airplanes.
  6. The United States is ranked at number 19 for quality of infrastructure, behind Denmark, Spain, Portugal and United Arab Emirates.
  7. Infrastructure spending has plummeted since 2008 due to both federal and state budget cuts.
  8. About 20 percent of our nation’s fresh, treated water — about 1.7 trillion gallons — is lost as a result of crumbling subterranean infrastructure.
  9. There are over 237,000 water main breaks every year in the U.S. That’s 700 a day, and almost one every two minutes.
  10. Our electricity infrastructure is also in need of immediate attention. Rolling blackouts, brownouts and general shortcomings in the US electrical grid costs around $80 billion a year.
  11. Between 1995 and 2004, highway mileage grew at an average rate of .2 percent, while vehicle miles traveled increased at an average rate of 2.5 percent. In other words, the number of Americans travelling is growing at a far faster pace than the rate of highway development.
  12. Traffic congestion costs the United States approximately $124 billion each year, and the average American commuter spends 38 hours a year stuck in traffic. In Boston, that number rises to over 50 hours.
  13. Over 4,000 of America’s dams are considered unsafe, 1,300 of which are considered high hazard, meaning their failure would result in loss of life.
  14. One third of all highway fatalities are the result of poor road conditions, dated road designs and layout, or roadside hazards.
last spike 1869
The world’s First Transcontinental Railroad was built between 1863 and 1869 to join the eastern and western halves of the United States. Shown here, shaking hands at the ceremony of the driving of the “last stake”, May 10, 1869.

But it’s not all bad news. With some targeted investing and smart building, we can modernize our infrastructure while contributing to America’s economic stability and workforce. The potential economic contribution of 30 large water and wastewater utilities over the next decade is $524 billion and 289,000 jobs. One billion dollars of investment in transportation infrastructure supports 34,700 jobs and provides about $1.8 billion of GDP, generating nearly $500 million in federal, state, and local tax revenues. Lastly, we have a ready and able construction workforce. In 2012, nearly 16 percent of America’s construction workers were unemployed.

Over the past century, the continued strength and viability of the United States has relied heavily on infrastructure and the people who make it all run smoothly: American public works employees. Investment in infrastructure now not only saves a significant amount of money in the future, but also supports the present economy and workforce. By making smart investments in infrastructure and protecting what has made this nation so great, we can continue to enjoy the quality of life for which America is known.

And that quality of life is also largely made possible by public works employees. So be sure to thank your public works professionals this week for a job well done. Happy National Public Works Week!

We are growing!

Tata & Howard's Jack O'Connell, P.E., Senior Vice President, who is overseeing construction, speaks with Seaver Construction's Mark Pelland, Superintendent of Construction
Jack O’Connell, P.E., Senior Vice President, who is overseeing construction, speaks with Seaver Construction’s Mark Pelland, Superintendent of Construction, in the new space.

Tata & Howard continues to grow at a pace where we have now outgrown our offices! Therefore, we have begun construction on an additional 4,645 square feet of space in our Marlborough, MA corporate headquarters. The additional square footage will add workspace for 18 employees as well as an additional conference room, modeling room, and printing/plotting room. ACTWO Architects from Wayland, MA designed the space, and Seaver Construction from Woburn, MA is handling the construction. Construction is expected to be completed in June.

Infrastructure Week 2015: Saving Our Nation’s Water Infrastructure

“It is very, very difficult to run a first-class county or city on second-rate infrastructure.” —Commissioner Melanie Worley, Douglass County, CO

showerInfrastructure. It’s something we take for granted every single day — when we make coffee, flush our toilets, or drive to work. Infrastructure is what keeps our economy moving and our lives healthy. The virtual eradication of water-borne illnesses such as cholera and typhoid fever are the direct result of improved water and wastwater infrastructure, and the economic growth and strength of the past 50 years is due largely in part to our extensive transportation system. Unfortunately, America’s infrastructure is now past its prime and aging fast, and if it is allowed to fall into total disrepair, the long-term negative economic impact to our nation would be devastating.

Infrastructure Week is a grassroots, stakeholder-driven movement whose affiliates span the nation and represent all sectors of the economy and civil society – from local chambers of commerce to labor unions to trade associations and private companies. Together, the coalition is united around delivering to Congress and the American people the core message of Infrastructure Week: Investing in America’s Economy. Infrastructure Week is bringing together thousands of stakeholders in Washington and around the country to highlight the critical importance of investing in and modernizing America’s infrastructure systems, and the essential role infrastructure plays in our economy.1

U.S. Infrastructure

rusty bridge
Corroded struts on a bridge

When we think of infrastructure, our primary focus is frequently on what we can directly see — our transportation system. Admittedly, our roads, bridges, railways, airports, and seaports are in desperate need of attention. Decades of neglect have left us with a crumbling transportation system resulting in productivity losses and safety concerns. One out of every nine of the nation’s 70,000 bridges is considered structurally deficient, and 42% of America’s major urban highways remain congested, resulting in an annual cost of about $100 billion in wasted time and fuel costs. Yes, our transportation system is certainly at risk. However, our water infrastructure is also in critical need of attention, including drinking water, wastewater, and stormwater systems as well as our nation’s dams.

Water Infrastructure

What are some typical tasks in the daily life of the average American? Take a shower, make coffee, prepare meals — maybe run a load of laundry or water the lawn. It is so easy to take these simple, everyday actions for granted, but they all rely on something we largely cannot see: water infrastructure. Water infrastructure isn’t just a few underground pipes. According to the EPA, water infrastructure includes all the man-made and natural features through which water is treated and moved. And while it is all part of the water environment, it is conducive to think about infrastructure in terms of drinking water, wastewater, and stormwater. Drinking water infrastructure includes lands in source water areas, reservoirs and storage, treatment plants, and distribution systems; wastewater infrastructure includes collection systems and pipes, pump stations, treatment plants, and septic systems; and stormwater infrastructure includes catch basins, stormwater pipes, green infrastructure approaches that infiltrate and manage water where it falls, and land management practices that keep runoff from adversely impacting surface water or groundwater.2 And let’s not forget dams. The U.S. has over 84,000 dams, 14,000 of which are considered high hazard, meaning that failure of the dam would likely cause the loss of life. Even more concerning is the fact that funding is simply not available for inspection and maintenance. For example, South Carolina has 2,380 dams, and the state employs only one full-time inspector and one half-time inspector to inspect them all.

Infrastructure Report Card

infrastructure report card
ASCE 2013 Infrastructure Report Card

So how does our nation’s infrastructure rate? In 2013, the American Society of Civil Engineers (ASCE) issued a report card giving an overall grade of D+, with drinking water, wastewater, and dams each receiving a D. Hazardous waste also received a D, which is significant because site cleanup is imperative to the safety of our nation’s water supply. The report, which is issued every four years, also noted that in order to bring our infrastructure up to par by 2020, the United States would have to invest $3.6 trillion. And while $3.6 trillion may seem daunting, the cost of allowing the nation’s infrastructure to crumble would be exponentially higher. Effective water infrastructure is imperative for maintaining public health, and a significant component of our nation’s economic viability.

Much of our nation’s water infrastructure dates back to WWII or earlier, with some east coast communities still using pipes that were installed in the late 1800’s. The Clean Water Act passed in 1974, and with it the country saw a boom in construction of wastewater treatment plants, many of which are now 30-40 years old, and likely in need of rehabilitation or replacement. The useful life cycle of pipes and treatment plants varies greatly, and is largely dependent on materials used, environment, and upkeep. In fact, some pipes from the early 1900’s are in better condition than those that are half their age. Therefore, it is critical that communities utilize methodologies such as Capital Efficiency Plans™ that evaluate the actual condition of critical components of infrastructure so that they make the most effective use of their very limited infrastructure dollars.

In 2002, the U.S. EPA released the Clean Water and Drinking Water Gap Analysis Report, which compared America’s drinking water and wastewater infrastructure needs to the available revenues of utilities. The report showed a projected gap in funding of over $500 billion over the next 20 years. And that’s just straightforward funding. These estimates do not include factors such as population growth or climate change, which will likely increase the funding gap significantly. So where do we start?

Finding a Solution

First and foremost, we must find a way to close the funding gap, which will require a multi-faceted approach. Community outreach and education on the value of water and on our nation’s critical infrastructure needs will be paramount as utilities request higher rates and better conservation practices to implement improvements and meet growing demand. And while rate increases will provide a portion of the much-needed funding, and conservation will help lower demand, utilities will still need to execute careful asset management in order to effectively improve our infrastructure long-term. In addition, implementation of effective management practices will dramatically increase utilities’ efficiency and sustainability. In fact, the EPA and six major professional associations in the water sector came together to develop and advocate an approach through the Effective Utility Management (EUM) partnership, which detailed ten attributes of effectively managed water sector utilities along with a framework for implementation in order to assist utilities with management practices in today’s challenging and complex climate.

business handshakeBut utilities and consumers alone will be unable to carry the full burden of the funding gap, and so we must look to more creative solutions. Already enacted in 2014 as part of the Water Resources and Reform Development Act, WIFIA provides low-interest federal loans for up to 49% of large drinking water, wastewater, and water reuse projects. Another option includes tax incentives for industry to implement water efficiency and recycling/reuse projects. These incentives will encourage more active involvement from the private sector, who many believe hold the key to funding the infrastructure of the future. In recent years, as public funding has drastically decreased while the need for infrastructure improvements has expanded, utilities and governments have become increasingly interested in public-private partnerships, or P3s. Of special note is the fact that the federal government is now encouraging and even providing assistance to the private sector to fund infrastructure. If current trending continues, it seems likely that P3s will hold a significant role in the future of water and wastewater infrastructure funding.

In Conclusion

dam inspection
Bunnells Pond Dam, CT, inspected by Tata & Howard in April 2015

In the United States, we have come to expect and even take for granted safe, clean drinking water at the turn of a tap and wastewater neatly whisked away without giving it a second thought. But if we take a moment to think about our lives without water infrastructure, we quickly realize how much we depend on it, and how important it is to maintaining a healthy, viable economy and country. Therefore, it is imperative that we collectively research and implement innovative ways in which to rehabilitate and replace our nation’s failing water infrastructure.

“For the U.S. economy to be the most competitive in the world, we need a first class infrastructure system,” said the ASCE report. “We must commit today to make our vision of the future a reality—an American infrastructure system that is the source of our prosperity.”

History of Water Distribution and Treatment

drinking water week 2015This week, May 3-9, is Drinking Water Week 2015, which is sponsored by the American Water Works Association (AWWA) and themed “What do you know about H2O?” Water is essential to life, and is the mainstay of civilization. People need water every single day not just for drinking, but also for industrial, agricultural, medical, and recreational needs. Reliable access to clean, safe water is critical to the health and success of society.

Reclaimed Water Infographic - From Toilet to Tap
Reclaimed Water Infographic – From Toilet to Tap

Drinking Water Week encourages the public to get to know their H2O and to understand how crucial water is to our daily lives. And while we have written about many water issues including sustainable development, water conservation, water reclamation, the criticality of water, where our water comes from, and the criticality of investing in our nation’s aging infrastructure, there is a constant: America has one of the safest drinking water supplies in the world, and in fact boasts 100 percent access to clean water and improved sanitation. So this week we’d like to take a step back in time and learn about the history of water distribution and sanitization.

HISTORY OF DISTRIBUTION

Mesopotamia — 3100 BC
Since the beginning of civilization, access to ample water has been paramount. Around 3100 BC, the first historically accepted civilization of people settled in Mesopotamia, the land made rich and fertile by the cyclical flooding of the Tigris and Euphrates Rivers. Ancient civilizations were always located near ample water supplies, and even ancient walking paths were routed past springs or streams. Ancients heavily prized any water supply that was clear, clean, and abundant, and the people would often dig wells to make collection easier as well as construct protective structures around these sources.

Persia — 700 BC
The first engineered distribution system came in the form of “qanats” in ancient Persia, now Armenia, around 700 BC. These qanats, which were open tunnels dug into hillsides, pushed groundwater from the hills to nearby cities or towns. The use of qanats became widespread and some still exist today. In fact, until 1933, the entire water supply of the Iranian capital city of Tehran was drawn from qanats.

Roman Empire — 312 BC

roman aqueducts
Roman aqueducts still stand today

Next came the Roman aqueducts, which were constructed both above and below ground between 312 BC and 455 AD. These aqueducts used gravity flow to bring water from distant sources into the cities, and some of these impressive structures are still in existence today. The longest aqueduct was the Aqua Marcia, which brought water from a source 23 miles outside the city of Rome. The actual length of the aqueduct was 57 miles due to its meandering twists and turns along the countryside that were necessary to maintain the steady downhill flow of water. Constructed in 144 BC, the Aqua Marcia was mostly underground. Only the last seven miles of the aqueduct were above ground, ending at Rome’s distribution reservoirs, from which the water was transported to fountains and baths. Only very few wealthy individuals had water piped directly into their homes. Pipes were mostly made of hollowed out logs or drilled stone, but a few were made of clay and lead as well.

Incas — 1450

Machu Picchu water fountain

One of the most wondrous examples of early hydraulic engineering is the Incan “Stairway of Fountains,” built around 1450 at the city of Machu Picchu. The fountains supplied the entire city with fresh springwater from a pair of rain-fed springs atop the mountain. At the main spring, which was a full half mile away from the first of 16 fountains, Incan engineers designed and constructed a 48-foot long permeable wall that fed a stone-lined canal which also collected water from the second, smaller spring. The canal, which was roughly both five inches wide and deep, had an average grade of three percent and could carry up to 80 gallons per minute, which was twice as much water as the peak flow for the springs. In this way, Incan engineers even prevented overflow and loss. The water flowed to the fountains, which were linked by stone channels that formed a 180 foot long cascade of water, or “water stairs”, with a total vertical drop of 65 feet. All of the fountains, even the emperor’s, were publicly accessible save for the last one, which was located inside the Temple of the Condor. This amazing early engineering feat not only provided a safe, dependable public water supply, but also served to protect the hillside architecture from erosion.

Boston, MA — 1652

wood water pipe boston
Wooden water pipe, said to have been laid prior to 1800. Unearthed in 1921 from the corner of Chauncy Street and Exeter Place, Boston, MA. Exhibit in the Joseph Allen Skinner Museum, South Hadley, Massachusetts, USA.

In 1652, Boston became home to the nation’s first waterworks, formed to provide water for fire-fighting and domestic usage. Fires were a common hazard in that time period of wood-framed homes and fireplaces, and a ready water supply was paramount. Bored-out logs were constructed from ten-inch thick hemlock or elm trees, cut into seven to nine foot lengths, and attached together with pitch or tar, or sometimes even iron hoops. In Boston, the line supplying the bustling community on the waterfront ran from Jamaica Pond to the Faneuil Hall area.

Wood proved problematic for several reasons: uneven ground caused the logs to sag and hold stagnated water, insects infested the pipes, the wood rotted, and the water often tasted woody. In addition, the increased pressure required to pump water into rapidly expanding cities began splitting the wooden pipes. Around this same time, iron became more readily available, and cities began using it in their distribution systems.

Philadelphia, PA— 1804

In 1804, Philadelphia became the first city in the world to utilize cast iron pipes for water mains and the first city to build a large-scale waterworks, which drew from the Schuykill River. New York City followed suit with a water distribution project that consisted of 41 miles of channel with a constant slope of 13.5 inches per mile. Completed in 1842, the project also had 16 tunnels, 114 culverts, and a bridge over Harlem River.

Waterworks were dependent on pumps, the first of which were waterwheels and simple hydraulic pumps. By the 1800s, steam powered windmills came into widespread use due to the ever-expanding population and industrial revolution. For example, Chicago’s population was 350 in 1835. By mid-century, it had soared to more than 60,000 people! And in 1869, Chicago made worldwide newspaper headlines when it unveiled its incredible engineering feat.

Chicago, IL  — 1869

water tower chicago
Chicago’s famed water standpipe still stands today

The Chicago Waterpower utilized twin underground tunnels to supply the city with water. The first tunnel contained a 138-foot tall, three-foot wide standpipe that equalized pressure in the city’s mains. The standpipe survived the Great Chicago Fire of 1871 and still stands today as a historical structure. Steam-driven engines drew water from Lake Michigan and provided 15 million gallons per day to the city’s water mains. Today, six engines pump 72.5 million gallons per day to the city of Chicago, and more than 90 perent of the U.S. population is supplied water from municipal supplies.

HISTORY OF TREATMENT

Civilizations have understood the necessity for both dependable water supplies and water treatment for over six thousand years. Ancient Sanskrit texts discuss boiling, sunlight exposure, and charcoal filtering as methods to treat turbidity, or visible cloudiness. Ancient Egyptians even utilized coagulants, which are chemicals still used today to remove suspended particles in drinking water. Greeks and Romans utilized purification methods including sand filtration, water settling, and storage in copper pots. Because ancients had no knowledge of microbes and their only concern was turbidity, no additional progress was made on water sanitation until the 1800s.

The Discovery of Pathogens

cholera bacteria under microscope
Microscopic image of Cholerae bacteria, which causes Cholera

The single most important breakthrough in water treatment was the understanding that disease is transmitted through microbes in untreated water. In 1804, Paisley, Scotland constructed the first large-scale water treatment plant, which utilized slow sand filtration. And in 1855, epidemiologist Dr. John Snow proved that cholera was a water-borne illness by linking an outbreak of the disease in London to a public well that had been contaminated with sewage. London started utilizing sand filters for its drinking water and saw a drastic reduction in cholera cases. Later in the 1800s, Louis Pasteur showed how microscopic organisms, or microbes, transmitted disease through water — the “germ theory”.

Chlorine
The discovery of chlorine as a microbicide revolutionized water treatment. Maidstone, England was the first city in the world to treat all of its water supply with chlorine, and Jersey City, New Jersey was the first city in the United States to disinfect public water using chlorination in 1908. Starting in 1910, routine chlorination became widespread in the United States, and over the next few decades, the country saw a drastic reduction in typhoid fever deaths.

Federal Regulation

water treatment plant littleton ma
Thanks to the Safe Drinking Water Act, virtually all water in the U.S. is now treated to stringent drinking water standards.

The U.S. Public Health Service implemented the first regulation of drinking water quality in 1914, and it only applied to contaminants capable of causing contagious disease. The Public Health Service revised and expanded these regulations in 1925, 1946, and 1962, the latter of which was adopted by all 50 states and encompassed 28 substances. By the late 1960’s, however, it became apparent that additional oversight was needed. Now not only were aesthetic problems, pathogens, and naturally occuring chemicals a concern, but also man-made toxins and chemicals caused by the industrial and agricultural advances of the time. Factory discharges, farm and field runoff, and leaking underground storage tanks were leaching chemicals into the drinking water supply, causing health and environmental concerns.

The Public Health Service conducted a survey in 1969 that had some sobering results: only 60 percent of the nation’s water systems delivered water that met the Public Health Service’s standards. In addition, a 1972 study found 36 chemcials in treated water taken from treatment plants along the Mississippi River. These studies, along with an increased awareness of the environmental impact of industrialization, led to the passage of several environmental and health laws, including the Safe Drinking Water Act in 1974. Amended in 1986 and 1996, the Safe Drinking Water Act is now under the administration of the U.S. Environmental Protection Agency’s Office of Ground Water and Drinking Water (EPA). One of the most important results of the Safe Drinking Water Act is the improvement of water treatment in small communities. Prior to the passage of the Act in 1974, only 33% of small to mid-sized communities provided any treatment at all. Today, nearly 100% of communities in the nation are supplied with drinking water that meets federal drinking water standards.

IN CONCLUSION

africa water crisis
A woman scoops unfiltered water from a dry riverbed near Kataboi village in remote Turkana in northern Kenya.

Safe, clean, and reliable drinking water is crucial to civilization and humanity, and we are fortunate to live in a time — and country — where drinking water is plentiful and safe. Unfortunately, the same does not hold true for the rest of the global population, with almost a billion people still without access to clean drinking water. So while we celebrate the impressive historical timeline of advancements in both distribution and treatment during Drinking Water Week 2015, we must all continue on the path of innovation until the global population’s water needs are met as well.

Happy Drinking Water Week 2015!

Tata & Howard Is Awarded the Highest Number of DWINSA Contracts in Massachusetts 

Tata & Howard Is Awarded the Highest Number of DWINSA Contracts in Massachusetts

Marlborough, MA engineering consulting firm selected by 16 public water systems to conduct their surveys 

Tata & Howard's corporate office in Marlborough, MA
Tata & Howard’s corporate office in Marlborough, MA

May 6, 2015 — Tata & Howard, Inc., a leading innovator in water, wastewater, stormwater, and environmental services engineering solutions, has been awarded 16 Drinking Water Infrastructure Needs Survey Assessments (DWINSA) by the Commonwealth of Massachusetts — Clean Water Trust and the Massachusetts Department of Environmental Protection (MassDEP). According to the MassDEP, the contracts represent the highest number awarded to any engineering consultant in the Commonwealth. DWINSA work is intended to identify capital asset needs for community water systems in the state through a DEP grant program.

“Our niche market has always been water,” said Patrick S. O’Neale, Vice President of Tata & Howard, Inc., and Project Manager for the DWINSA contracts. “Our targeted expertise, decades of experience, and exceptional service in the water environment have all contributed to our reputation as the area’s water expert, and these DWINSA contract awards solidify our standing as the leader in drinking water engineering solutions in Massachusetts.”

The following 16 public water systems selected Tata & Howard to conduct their 2015 DWINSA: Aquarion Water Company Millbury, Avon Water Department, Dighton Water District, Dudley Water Department, Edgartown Water Department, Falmouth Water Department, Halifax Water Department, Hingham/Hull Aquarion Water Company, Newton Water Department, Northampton Water Department, Pepperell DPW-Water Division, Sandwich Water District, Uxbridge DPW, Water Division, Westfield Water Department, Worcester DPW-Water Supply Division, and North Brookfield. All of the surveys require a 75% completion date by June 30, 2015.

Effective Water and Wastewater Utility Management

A water main break is a common occurrence with our nation’s failing infrastructure

As water and wastewater utilities nationwide face an increasing number of challenges, including rising costs and population, aging infrastructure, drought, increasingly stringent regulatory requirements, and a rapidly changing workforce, creative and innovative methodologies for treatment and distribution along with efficient and effective utility management have become paramount. In order to ensure a strong and viable utility for future generations, utilities must find ways to improve their products and services while increasing community support. Effective water and wastewater utility management helps utilities improve performance in critical areas while responding to current and future challenges, all with limited infrastructure dollars.

In May of 2007, six major water and wastewater associations and the U.S. Environmental Protection Agency signed an historic agreement pledging to support effective utility management collectively and individually throughout the water sector and to develop a joint strategy to identify, encourage, and recognize excellence in water and wastewater utility management. Participating organizations included the following:

  • Association of Metropolitan Water Agencies (AMWA)
  • American Public Works Association (APWA)
  • American Water Works Association (AWWA)
  • National Association of Clean Water Agencies (NACWA)
  • National Association of Water Companies (NAWC)
  • United States Environmental Protection Agency (EPA)
  • Water Environment Federation (WEF)

The result of this powerhouse collaboration was the Effective Utility Management Primer, issued in June of 2008. The Primer, designed specifically to assist water and wastewater managers in identifying and addressing their most urgent needs through a customized, incremental approach, outlines ten attributes of effectively managed utilities along with five keys to management success:

Ten Attributes of Effectively Managed Water Sector Utilities

  1. Effective Utility Management: A Primer for Water and WastewaterProduct Quality produces potable water, treated effluent, and process residuals in full compliance with regulatory and reliability requirements and consistent with customer, public health, and ecological needs.
  2. Customer Satisfaction provides reliable, responsive, and affordable services in line with explicit, customer- accepted service levels. Receives timely customer feedback to maintain responsiveness to customer needs and emergencies.
  3. Employee and Leadership Development recruits and retains a workforce that is competent, motivated, adaptive, and safe-working. Establishes a participatory, collaborative organization dedicated to continual learning and improvement. Ensures employee institutional knowledge is retained and improved upon over time. Provides a focus on and emphasizes opportunities for professional and leadership development and strives to create an integrated and well-coordinated senior leadership team.
  4. Operational Optimization ensures ongoing, timely, cost-effective, reliable, and sustainable performance improvements in all facets of its operations. Minimizes resource use, loss, and impacts from day-to-day operations. Maintains awareness of information and operational technology developments to anticipate and support timely adoption of improvements.
  5. Financial Viability understands the full life-cycle cost of the utility and establishes and maintains an effective balance between long-term debt, asset values, operations and maintenance expenditures, and operating revenues. Establishes predictable rates—consistent with community expectations and acceptability—adequate to recover costs, provide for reserves, maintain support from bond rating agencies, and plan and invest for future needs.
  6. Infrastructure Stability understands the condition of and costs associated with critical infrastructure assets. Maintains and enhances the condition of all assets over the long-term at the lowest possible life-cycle cost and acceptable risk consistent with customer, community, and regulator-supported service levels, and consistent with anticipated growth and system reliability goals. Assures asset repair, rehabilitation, and replacement efforts are coordinated within the community to minimize disruptions and other negative consequences.
  7. Operational Resiliency ensures utility leadership and staff work together to anticipate and avoid problems. Proactively identifies, assesses, establishes tolerance levels for, and effectively manages a full range of business risks (including legal, regulatory, financial, environmental, safety, security, and natural disaster-related) in a proactive way consistent with industry trends and system reliability goals.
  8. Community Sustainability is explicitly cognizant of and attentive to the impacts its decisions have on current and long-term future community and watershed health and welfare. Manages operations, infrastructure, and investments to protect, restore, and enhance the natural environment; efficiently uses water and energy resources; promotes economic vitality; and engenders overall community improvement. Explicitly considers a variety of pollution prevention, watershed, and source water protection approaches as part of an overall strategy to maintain and enhance ecological and community sustainability.
  9. Water Resource Adequacy ensures water availability consistent with current and future customer needs through long-term resource supply and demand analysis, conservation, and public education. Explicitly considers its role in water availability and manages operations to provide for long-term aquifer and surface water sustainability and replenishment.
  10. Stakeholder Understanding and Support engenders understanding and support from oversight bodies, community and watershed interests, and regulatory bodies for service levels, rate structures, operating budgets, capital improvement programs, and risk management decisions. Actively involves stakeholders in the decisions that will affect them.

Five Keys to Management Success

  1. water_utility_leadershipLeadership
    Leadership is critical to effective utility management, particularly in the context of driving and inspiring change within an organization. Leadership refers both to individuals who can be effective champions for improvement, and to teams that provide resilient, day-to-day management continuity and direction. Effective leadership ensures that the utility’s direction is understood, embraced, and followed on an ongoing basis throughout the management cycle.
  2. Strategic Business Planning
    Strategic business planning is an important tool for achieving balance and cohesion across the Attributes. A strategic plan provides a framework for decision making by assessing current conditions, strengths and weaknesses; assessing underlying causes and effects; and establishing vision, objectives, and strategies. It establishes specific implementation steps that will move a utility from its current level of performance to achieving its vision.
  3. Organizational Approaches
    There are a variety of organizational approaches that contribute to overall effective utility management and that are critical to the success of management improvement efforts, including actively engaging employees in improvement efforts; deploying an explicit change management process that anticipates and plans for change and encourages staff at all levels to embrace change; and utilizing implementation strategies that seek, identify, and celebrate victories.
  4. Measurement
    Measurement is critical to management improvement efforts and is the backbone of successful continual improvement management and strategic business planning. A measurement system serves many vital purposes, including focusing attention on key issues, clarifying expectations, facilitating decision making, and, most importantly, learning and improving.
  5. Continual Improvement Management Framework
    A continual improvement management framework can help utilities understand improvement opportunities and establish explicit service levels, guide investment and operational decisions, form the basis for ongoing measurement, and provide the ability to communicate clearly with customers and key stakeholders. This framework plays a central role in effective utility management and is critical to making progress.

OK – Now What?

business_overwhelmedSo how does a utility assess, address, and implement these changes? The primer further recommended an assessment tool with five steps, for which the instructions comprise the latter 35 pages of the Effective Utility Management Primer. Admittedly, the entire process requires dedicated time and personnel commitment from the utility. While some utility managers have had success in applying the assessment to their utility, many have found the process to require resources simply unavailable to them. Tata & Howard has developed two proprietary innovations that assist water and wastewater utilities in the identification of their most urgent needs as well as effective and efficient utility management.

Business Practice Evaluations

Business Practice Evaluations (BPEs) assess the health of a utility’s work practices by implementing a framework for a structured approach to managing, operating, and maintaining in a more business-like manner. This assessment provides the information and planning required by the Primer, specifically in the Five Keys to Management Success. A BPE’s primary focus is on effective management.

The overall goal of the assessment process is more efficient and effective work practices, and the assessment process and tools developed enable utility managers to assess the efficiency and effectiveness of the utility in comparison to generally accepted industry standards. The assessment includes documentation of current business practices, identification of opportunities for improvement, conducting interviews including a diagonal slice of the organization, and observation of work practices in the field. From this assessment we make recommendations to improve system performance, and the structured approach is fully customized and includes all functions of the utility — from administration and technical to operations and maintenance. The assessment process allows utility executives to proactively develop system specific plans, programs, and timelines to optimize the overall utility system programs.

Capital Efficiency Plans™

capitalWhere BPEs focus on management, Capital Efficiency Plans™ (CEPs) address the utility itself, combining the concepts of hydraulic modeling, system criticality, and asset management into a single comprehensive report. Each report is customized to the individual utility system and provides utilities with a database and Geographic Information System (GIS) representation for each pipe segment within their underground piping system. The CEP report also prioritizes system piping improvements and provides estimated costs for replacement and rehabilitation.

Each water and wastewater system has unique characteristics and challenges that are discussed at our CEP workshop held with knowledgeable field staff and managers for each project. The workshops provide significant value by filling in data gaps, correcting incorrect records, and identifying specific issues and critical components that are custom to the system. Our completed studies have been well received by many utilities who have found our methodology not only practical and understandable, but also defendable when justifying projects and procuring funding.

In Conclusion

Water and wastewater utilities today are finding themselves increasingly burdened with decreased revenue, excessive demand, and crumbling infrastrucure. Strict new regulations and a changing workforce have also added to the challenge, and it is imperative that water and wastewater utilities find ways to efficiently and effectively improve systems while implementing successful management strategies. Targeted assessments, strategic planning, and identification and implementation of best practices will be the foundation of all successful utilities in the future.