Managing Nutrient Pollution in Our Water

Runoff of phosphorus and nitrogen from farming, stormwater, and wastewater treatment plants is an increasing issue for aquatic environments around the world. While phosphate and nitrogen are natural and necessary components of aquatic ecosystems, too much can be dangerous. Excess amounts of these nutrients, also known as nutrient pollution, is detrimental to plants, wildlife, waterways, and our own public health. Although this issue is not new, there’s been an uptick in awareness as water and wastewater utilities aim to improve drinking water quality and meet regulatory requirements.


Problems with Excess Nutrients

Nutrient pollution is a widespread problem that affects rivers, streams, lakes, bays, and coastal waters across the country.


Algal Blooms

Increased levels of phosphorus and nitrogen can cause harmful algal blooms that ultimately lead to the production of toxins and elevated bacteria levels that are harmful to people and wildlife. In fact, nutrient pollution can cause issues in water quality both near and far from the location where the nutrients enter the water source. A study from the US Water Alliance noted an instance of water pollution where excess nutrients from the Mississippi River Basin caused toxic algal blooms 2,300 miles downstream in the Gulf of Mexico. The algae later decomposed, all while consuming large amounts of oxygen and creating dead zones in which aquatic organisms could not survive.


harmful algal blooms covering a body of water


Treatment Costs

When it comes to treating wastewater and providing high-quality drinking water to customers, costs will rise for water utilities should the water be saturated with excess nutrients.


Recreational Opportunities

The problems that stem from excess nutrients in water bodies negatively impact the livelihood of those who use the water for recreational purposes. According to the EPA, the US tourism industry loses nearly $1 billion each year, while the commercial fishing industry loses tens of millions.


Sources of Excess Nutrients

Most excess nutrients in the water originate from agricultural runoff, urban stormwater, and discharge from wastewater treatment plants. There are two types of sources – “point” sources and “nonpoint” sources. Point sources typically refer to industrial and municipal wastewater treatment plants. Nonpoint sources refer to agricultural and stormwater runoff.


Point Sources

$1.4 trillion in public funding has been invested in improving municipal wastewater treatment facilities to address nutrient pollution since 1972.


Nonpoint Sources

The primary approach to reducing nutrient pollution of agricultural nonpoint sources has been the implementation of ‘Best Management Practices’. Best practices vary on a farm-by-farm basis and have the potential to be cost-effective or expensive, depending on several factors. Because farm practices are unpredictable due to cropping patterns, soil properties, hydrology, and weather, many farmers are hesitant to change their current practice. Compared to point sources, a mere $5 billion has bene spent by the federal government to incentivize farmers to implement strategies for nutrient reduction. Additionally, when it comes to nonpoint sources of excess nutrients including stormwater, a lot more can be done on the ground level. Being mindful of what goes down the drain in our yards, and on the streets, can have a huge impact.


Efforts for Reducing Nutrient Pollution

There are many programs in place on both the federal and state level to help reduce nutrient pollution levels. Below are just a few.


The Clean Water Act

This Act regulates point source discharge and requires all dischargers to obtain a National Pollutant Discharge Elimination System (NPDES) permit from the state. NPDES permits enforce limits on the concentration of nutrients that can be discharged into surface waters. Under Section 319 of the Clean Water Act, the EPA also supports state efforts to reduce nonpoint sources of nutrient pollution with its $160 million grant program. According to the EPA, activities supported by these programs may include implementation of state nonpoint source management plans, state regulatory and non-regulatory programs, watershed prioritization and planning, and nonpoint source monitoring.


Financing

Several loans exist specifically for upgrades and construction of wastewater facilities. The State Revolving Fund program offers low-interest loans for wastewater treatment infrastructure, and the USDA’s Rural Development Water and Environmental Programs provide long-term, low-interest loans and grants for the construction of these facilities in rural communities. The USDA and EPA also support the reduction of nutrient pollution by incentivizing voluntary action by nonpoint sources. There are a handful of programs that provide a mix of funding directly to farmers, or to groups at the community or state level.


Partnerships

The EPA and five other federal agencies co-lead the Gulf Hypoxia Task Force. This federal initiative was developed in 2008 (and adopted by 12 states) to reduce nutrient loads by 20 percent by 2025 and by 45 percent by 2035. Other partnerships created to reduce the impacts of nutrient pollution include Source Water Collaborative and the Animal Agriculture Discussion Group.


Outreach

The EPA is working with its partners to combat nutrient pollution in water bodies throughout the country. They’ve created a wealth of communication and outreach materials to increase awareness of the causes, effects, and solutions to nutrient pollution.


Conclusion

In conclusion, we must continue addressing the problem of nutrient pollution in water bodies across the country. While there are several initiatives in place to combat the harmful effects of nitrogen and phosphorus entering the environment, nutrient pollution is increasing at a quicker rate than what is being done to eliminate it. Federal and state agencies, farmers, and even you can play a tremendous role in reducing nutrient pollution. Learn what you can do within your community here.

The Effects of Water Pollution During Summer

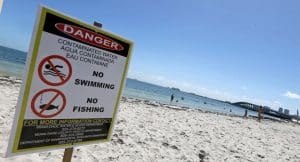
On a warm summer day, nothing feels quite as nice as a refreshing dip in the water. Until the water is contaminated, that is. In the past year, nearly 60 percent of the 4,500 tested beaches across the country had water pollution levels (on at least one occasion) that put swimmers at risk of getting sick. Well over 2,000 beaches surpassed the EPA’s margin of safety. Polluted waters can lead to a variety of stomach and respiratory illnesses in swimmers, and ultimately cause an estimated 57 million cases of waterborne illnesses every year.

According to the EPA’s most recent Water Quality Assessment data, fecal matter from sewage overflows and stormwater runoff in highly settled areas are the two of the largest causes of waterway contamination.

photo of beach with sign warning swimmers not to swim in contaminated water

Stormwater

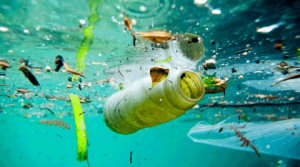
Stormwater flowing over both suburban and urban areas pick up fecal matter from pets and wildlife along the way. This waste carries bacteria which leads to illnesses. The Centers for Disease Control and Prevention (CDC) reported that from 2000 to 2014, 140 outbreaks caused by recreational water contamination caused nearly 5,000 illnesses and two deaths. Consuming seafood harvested from contaminated waters can also cause an equally harmful health threat. In addition, studies in California show that swimmers directly in the flow of storm drains are 50% more likely to develop an illness than those who are just 400 more yards away from the same drainage flow.

Sewage Overflows

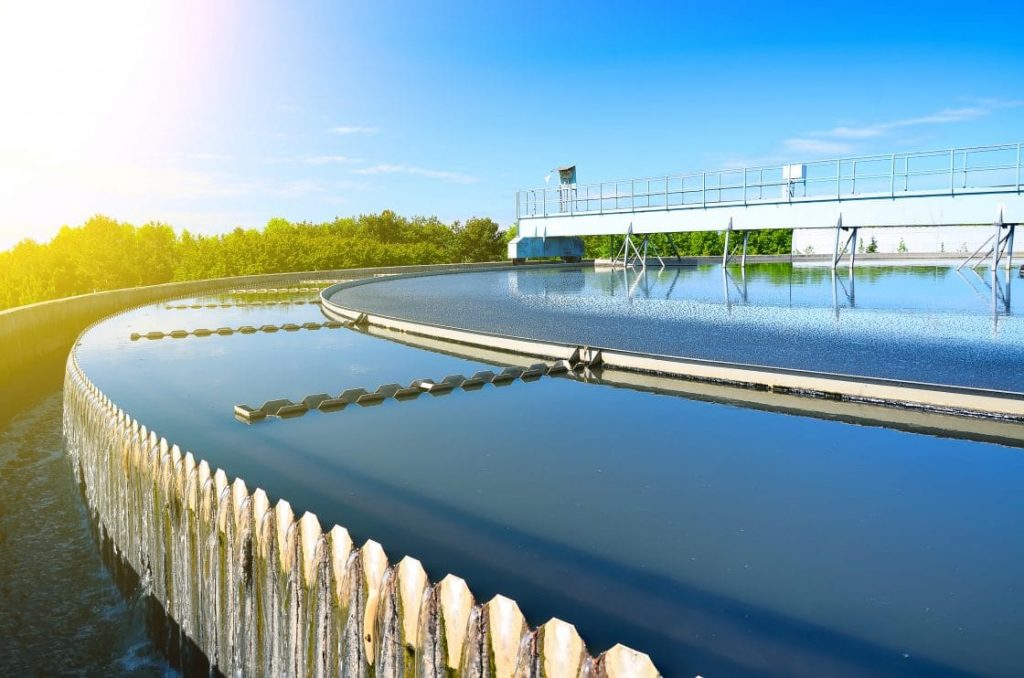
The EPA estimated that 850 billion gallons of untreated water were released into waterways as a result of sewage overflows. Sewage contamination contains human waste comprised of bacteria, viruses, and parasites capable of causing diseases.

The Effects of Fecal Contamination

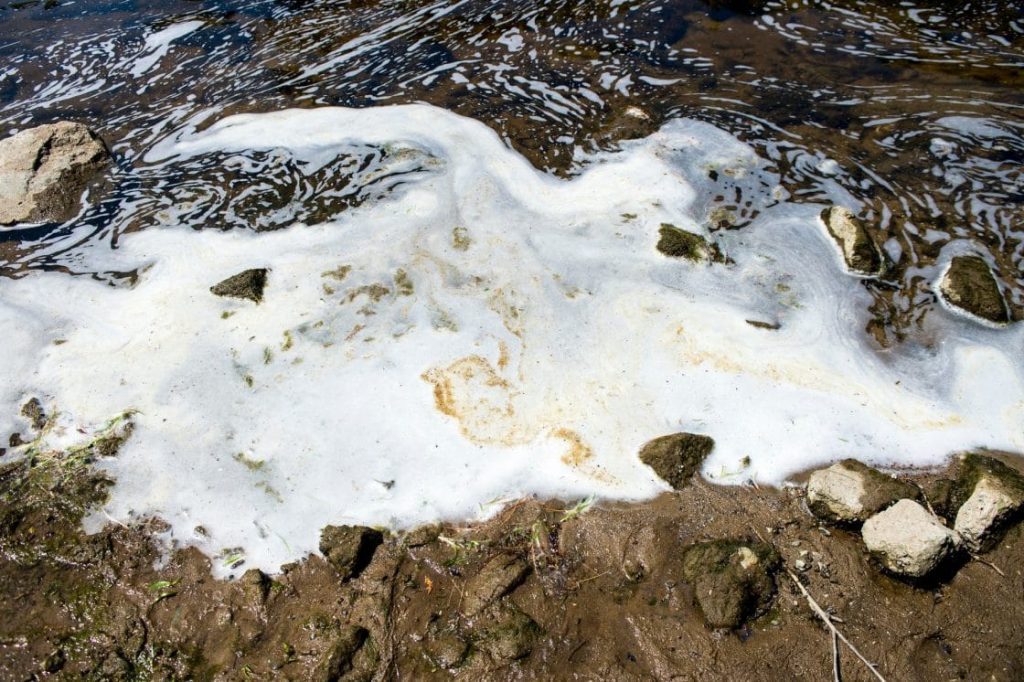
Data from the 2018 National Water Quality Monitoring Councils’ Water Quality Portal showed staggering levels of contaminants from stormwater runoff and sewage overflows. Approximately 58 percent of beach sites tested in 29 coastal and Great Lakes states had unsafe levels of fecal contamination for swimming on at least one day.

Tested sites were unsafe if bacteria levels exceeded the EPA’s ‘Beach Action Value.’ These levels were reached in every region of the country.

  • Gulf Coast Beaches – 329 sites (85 percent of the 385 sites tested) were unsafe for at least one day
  • West Coast Beaches – 573 sites (67 percent of the 850 sites tested) were unsafe for at least one day
  • East Coast Beaches – 1,134 sites (48 percent of the 2,373 sites tested) were unsafe for at least one day
  • Great Lake Beaches – 418 sites (75 percent of the 558 sites tested) were unsafe for at least one day

Keeping our waterways clean, especially during the summer months, is critical. Luckily, we can all help reduce the number of contaminants reaching our favorite beaches and swimming holes.

Here are some helpful tips to stay safe at the beach this summer by preventing water pollution:

Prevent Urban Runoff Pollution

  • Advocate for natural and green infrastructure that prevent bacteria-laden pollution, such as rain barrels, permeable pavement, urban greenspace, and green roofs.
  • Protect and restore natural infrastructure such as wetlands that can filter bacteria, sediments, and nutrients.
  • Wash your car at a commercial car wash, or on an unpaved surface so the excess water can be absorbed by the ground.
  • Keep yard clippings out of the street. Sweep driveways and yards instead of hosing them down and letting residual materials flow into the storm drains.
  • Clean up oil spills and fix leaking automobiles.
urban water pollution shows plastic and other matter in ocean

Prevent Sewage Pollution

  • Advocate for public investments in fixing aging sewer systems.
  • Advocate for upgrade or relocation of wastewater facilities that are in danger of overflowing during storms and floods.
  • Ensure frequent inspections and proper maintenance of residential septic systems.

Prevent Manure Pollution

  • Help design best practices for reducing manure pollution from cropland, including the maintenance of conservation buffers set up around fields.
  • Encourage livestock operations to raise animals on rotational pastures.

Will you be able to put these into effect in efforts to stop stormwater pollution? What else are you doing to keep our waterways clean?

Asset Management Grant Program Available in MA

Calling All Water Utilities!

The Massachusetts Department of Environmental Protection (MassDEP) and the Massachusetts Clean Water Trust (the Trust) are currently promoting Asset Management Programs (AMPs) by offering subsidized State Revolving Fund (SRF) financing for communities looking to improve one or more of their water-related utilities.

With the help of Asset Management Programs, water, wastewater, and stormwater utilities are poised to make beneficial financial decisions for the future. The goal of AMPs is to achieve long-term sustainability and deliver the required level of service in a cost-efficient manner. Financial decisions surrounding asset repairs, replacements, or rehabilitations, as well as the development and implementation of a long-term funding strategy can only help a utility.

Through the Asset Management Grant Program, MassDEP and the Trust are encouraging water utilities to focus on AMP development, maintenance, or improvements. This program is also aimed at helping communities and their utilities meet the Engineering Plan and Financial Sustainability Plan requirements for SRF construction loans. With that, the program will award grants with a maximum award of $150,000 or 60% of the total eligible project cost (whatever is less).

If awarded a grant, the recipient will be required to supply documentation of a full appropriation of funding mechanisms for the entire cost of the project to qualify. There are no requirements on the size or scope of the project. MassDEP will favor proposals that include a clear description of the applicant’s current asset management status and goals, and those that demonstrate a strong commitment to participate in their AMP.

Apply Today!

Tata & Howard encourages all MA utilities to apply for this special grant funding. Proposals and Project Evaluation Forms are due on August 23, 2019 by 12 pm.

For more detailed information concerning requirements and deadlines, please view the Guidelines for Proposal Submittal and Project Selection provided by MassDEP.

Asset Management

As one of MassDEP’s pre-qualified consulting engineering firms, Tata & Howard provides industry expertise in both Asset Management and funding assistance. For more information on Asset Management or how Tata & Howard can assist with your grant application, visit our website or contact us directly. We are happy to assist.

How ESOPs Benefit Employers and Employees

Part of every successful client-based business is the ability to retain existing clients. In order to retain these clients however, a business needs highly skilled, engaged, and happy employees. When an employee feels valued and can see the positive impacts of their work, they are more inclined to stay on board. With this notion, long-term success is hinged on finding exceptional talent, and training exceptional talent. But in which ways can this be done in such a competitive workforce? One way is to consider implementing an employee stock ownership plan (ESOP) to benefit employers and employees.

An ESOP is a type of retirement plan, similar in some ways to traditional plans like a 401(k). Studies show that ESOP companies grow about 2.5 times as fast as non-ESOP companies. They also are known to provide employees with up to 2.2 times the retirement assets.

Owner Benefits

ESOPs are defined contribution retirement plans that invest primarily in the common stock of the company. It is unique among retirement plans in that it can borrow money. This allows the ESOP to be a flexible succession strategy for a business owner who is looking to sell all or part of their business.

Aside from gains via engaged employees, there are a few reasons why business owners and employers choose to implement ESOPs into their business. For one, if (and when) it comes time for the business owner to sell, the company wouldn’t be thrown into the hands of someone completely unrelated to the business. Instead, selling to the ESOP means that: 

  • the company stays in place
  • the people who’ve helped build it get rewarded
  • the owner has the flexibility in terms of how much to sell and what role they’ll play in the future
  • the company nets substantial tax benefits

Employer Benefits

In the 21st annual survey completed by The Employee Ownership Foundation, ESOPs have been shown to improve overall company performance. The results showed that:

  • 76% of respondents indicated the ESOP positively affected the overall productivity of the employees
  • 70.5% of respondents reported profitability increased and 76.2% of respondents noted revenue increased
  • 80% of respondents stated the company’s stock value increased

Another significant survey conducted by Douglas Kruse and Joseph Blasi of Rutgers University reported that ESOPs increase sales, and sales per employee by 2.3 to 2.4 percent per year.

So how does this happen, just by having an ESOP as opposed to a typical retirement plan like a 401(k)? The bottom line is that an ESOP creates aligned incentives. Through the ESOP, employees earn ownership in the company, which make those eight or nine hours spent at work all the more worthwhile.

Employee Benefits

ESOPs have proven to be just as beneficial for the employees working at the company. When it comes to planning for retirement, employees want to rest assured that they will be financially stable. As such, Corey Rosen, co-founder and senior staff member of the National Center for Employee Ownership, stated that ESOP balances were three to five times higher on average than 401(k) plan balances. 

graphic displaying multiple hands grabbing a piece of the (company) pie

In addition to the financial benefits of an ESOP, there are certainly other perks that make employee owners feel valued and inclined to stay in their company. Firstly, is the notion of job security. ESOPs have been known to have lower turnover rates and are much less likely to lay people off. Secondly, ESOPs have proven to increase the well-being of their employees. Additional benefits include:

  • Greater feelings or job security and satisfaction
  • Increased trust in the management/company

In conclusion, employee stock ownership plans benefit the company, the owners, and the employees. An ESOP can be an excellent strategy for a company looking to enhance organizational performance, help employees prepare for retirement, and allow a business owner to meet succession or diversification goals. Do keep in mind that while all of these statistics may seem compelling, implementing an ESOP is not for every company, and lots of decision making must go into the process. If you are interested in learning more and implementing an ESOP into your business, be sure to do plenty of research!

Wastewater Rundown: Direct Potable Reuse vs. Indirect Potable Reuse

Every day we encounter wastewater. We create it through flushing the toilet, washing our hands, taking showers, running the dishwasher, and more. In fact, all water affected by human use is wastewater. Although it’s a constant part of our lives, wastewater is often overlooked. Have you ever thought about what happens to the water we flush away? Where does it go? How does it get treated? Do we use it again? Read on to learn about the ways in which we utilize treated wastewater, particularly through direct potable reuse and indirect potable reuse.

The Quick (and Dirty)

The wastewater treatment process begins the second a drop of water goes down the drain. That water becomes sewage – which is 99 percent dirty water. The other one percent is made up of solids, chemicals, fats, nutrients, and other miscellaneous matter. From here, water travels within the sewage network through pipes, pumps, and plants for treatment. First in this process is the screening of large objects and debris from the water. Next, bacteria, contaminants, organic, and inorganic matter are removed through digestion and aeration processes. Within these phases, nutrients such as nitrogen and phosphorus are reduced to protect the environment and support our communities. When the water is clean, it then goes on to be clarified and disinfected with chlorine or ultraviolet light.

A Bright Idea

For as long as time, humans have relied on the natural water cycle to obtain drinking water. From the days of sifting water from brooks to later advancements including drinking water treatment facilities – the source of our drinking water has always come from surface or groundwater. When water is plentiful, we source it from watersheds and treat it to drinking water standards. But what happens when water supplies run low? When there is less rain and more demand for water? One solution is potable water reuse – the notion of reusing the used water we normally discard for drinking. The two types of potable water reuse are indirect potable reuse and direct potable reuse.

Indirect Potable Reuse

Indirect potable reuse (IPR) is more common and has been successfully used within the United States for the last 50 years. With IPR, water is first treated at a wastewater treatment facility. It is then pumped into a natural basin or reservoir where it is filtered naturally through the ground before being sent back into the water supply. The downside of IPR is that the water gets ‘dirty’ all over again and needs to be treated once more before it is safe to drink.

Direct Potable Reuse

On the contrary, direct portable reuse (DPR) is a fairly new concept and involves the treatment and distribution of water without an environmental buffer. In this process, the very clean water from the advanced water purification plant is put straight back into the water supply. These advanced purification systems are used by utilities around the world and process and test the water supply to ensure standards are met.

T&H designed the Home Farm Water Treatment Plant in Shrewsbury, MA

The first DPR system was implemented about five years ago in Big Spring, TX to face the state’s relentless droughts. The DPR system at the Colorado River Municipal Water District in Big Spring takes treated wastewater, purifies it, and then mixes it with the city’s regular water supply. Eventually, water heads back to consumers’ taps.

Although the DPR process is new in the grand scheme of things, it has proven to be effective. As we face global climate change and recognize drinking water as the valuable resource it is, innovations like DPR are certainly beneficial.

What are your thoughts on DPR?


Clean Water Inspired by a Rose

When thinking of flowers, it’s hard not to appreciate the water that is necessary for them to grow. But have you ever thought about the significance of a flower when it comes to clean water?

A team in the Cockrell School of Engineering at the University of Texas at Austin has developed a new device for collecting and purifying water. Inspired by the structure of a rose, the flower-like device costs less than two cents to make and can supply more than a half-gallon of water per square meter.

water filtration and production device that resembles the inner workers of a rose.
Photo: UTexas.edu

Inspiration

The team of Ph.D. candidates led by Professor Donglei Fan were fueled by the creation of a new approach for solar steaming – a technique that uses energy from the sun to separate salt and other impurities from water through evaporation. Their origami rose inspired system could be a new paradigm for water production and treatment for both individuals and homes.

Existing solar-steaming technologies are typically bulky, expensive, and produce limited results. The UT team aimed to create a solution using portable, lightweight and inexpensive materials. The result – a product that looks like a black-petaled rose in a glass jar. While portable and low-pressure controlled solar-steaming systems known as ‘unisystems’ do exist, the flower structure portion of the design is new.

Inner-workings

The system is made from layered, black paper sheets that are shaped into petals. The 3D rose shape, attached to a stem-like tube that collects untreated water from any water source, makes it easier for the structure to collect and retain more liquid. The black paper is filtered and coated with a polymer known as polypyrrole. Polypyrrole is a material known for its photothermal properties – meaning that it coverts solar light into thermal heat.

Water Collection

There are two ways in which the device collects water. The first is through the stem-like tube that feeds water to the flower-inspired structure on top. The second way is through collecting water from above – occurring in instances such as rainfall. In either case, water finds its way to the petals where the polypyrrole coating turns the water into steam. The impurities are naturally separated from water when condensed in this way. By the end of the purification process, the device can remove contamination from heavy metals and bacteria, as well as salt from seawater. The result is clean water that meets drinking standard requirements set by the World Health Organization.

In addition to the new, flower-like structure, the system was also designed to include a connection point for a low-pressure pump. This pump will help condense water more effectively. Once condensed, water will fall into a compact, sturdy and secure glass jar. Weigu Li, a Ph.D. candidate in Fan’s lab said that their “rational design and low-cost fabrication of 3D origami photothermal materials represents a first-of-its-kind portable low-pressure solar-steaming-collection system” could inspire a new wave of clean water production technologies.

Donald J. Tata Engineering Scholarship 2019 Recipients

MARLBOROUGH, MA, JULY 19, 2019

Tata & Howard, Inc. is pleased to announce Conner Bogle and Thatcher Schechtman as the recipients of the 2019 Donald J. Tata Engineering Scholarship.

two recipients of Donald J. Tata Engineering Scholarship, Conner Bogle and Thatcher Schetchman

The Donald J. Tata Engineering Scholarship was established in 2017 to honor the late Don Tata, co-founder and former CEO of Tata & Howard, Inc. Each year, the scholarship is given to one student from both Marlborough and Natick High School. Eligible recipients must be graduating seniors with plans to attend a four-year college or university to pursue a degree in engineering.

“We are proud to offer scholarships to these accomplished students and support the Marlborough and Natick communities, home to Tata & Howard headquarters and the Tata family, respectively,” said Tata & Howard Co-President Karen Gracey, P.E. “While we had many exemplary applicants, Conner and Thatcher’s academic achievements and future career goals made a lasting impression.”

Conner Bogle will be attending Western New England University this fall to study mechanical engineering. Inspired by the way engineering can positively impact the world, Conner’s passion sparked from his high school STEM program where he designed an outdoor amphitheater-style classroom that eventually made its way to the Massachusetts State Science Fair. In addition to his studies, Conner was the president of the VEX and FIRST Robotics Clubs, and participated in martial arts, the Marlborough High School golf team, and advanced band.

Thatcher Schechtman will be attending the University of Connecticut this fall to study civil engineering. With sights set on bettering infrastructure on a local, national and global level, Thatcher hopes to create safer bridges, more durable roads, cleaner energy systems, and more sustainable water systems. A member of the National Honor Society, Thatcher also spent time volunteering with several organizations within the local community and beyond.

“Conner and Thatcher’s ambitions, talents, and leadership skills are demonstrative of their commitment to making a positive contribution to the world,” added Paul B. Howard, P.E., Sr. Vice President and co-founder of the firm. “We wish these students success in their future academic endeavors and know that Don would be proud to see them honored for their achievements.” 

Point of Use Water Filters Effectively Reduce Lead in Flint, MI Water

In the last decade, the discussion of lead in drinking water has been on the rise. While the Flint, MI water crisis may have been a catalyst for the recent uptick in awareness, lead poisoning from drinking water is not isolated to Flint alone. Schools and homes across the country are at risk for unhealthy lead levels in their water. In fact, 15-25 million homes in the U.S. are still connected to lead pipelines that were laid before they were banned in the late 1980s. In addition, 43 percent of school districts serving 35 million students across the country tested positive for lead. Of those, 37 percent found elevated levels and reduced or eliminated exposure, according to the U.S. Government Accountability Office.  

lead contaminated water being displayed in a milk jug to show contamination levels.

In addition to water utilities adjusting water chemistry to minimize the possibility of lead dissolving into tap water, customers can also do their part to help reduce lead levels. Although the best way to eliminate lead exposure in water is by replacing lead service lines and interior plumbing, there are in fact ways to minimize exposure to meet the EPA’s Lead Action Level in your home. One of these ways is through point of use (POU) water filters. Properly installed POU filters can potentially protect all populations, including children and pregnant women.

A recent study published in the Journal of Environmental Science and Health, showed that POU filters effectively reduced lead in drinking water in a demonstration field study in Flint, Michigan.

Intro to Point of Use Water Treatment Devices

Filtration of tap drinking water in homes through POU treatment devices has gained popularity due to recent concerns of lead contamination from service lines and interior plumbing materials. According to the field study, many POU filters utilize an outer fabric of fiber surrounding a solid block primarily composed of activated carbon. Activated carbon is great for purifying liquids and gases.

Materials and Methods for the Study

Flint residents received PUR and BRITA filters [certified under NSF/ANSI-53 (total lead) and NSF/ANSI-42 (Class I particulate)] for the study. Filtered and unfiltered water samples were collected to assess whether the NSF/ANSI-53 and NSF/ANSI-42 certified POU filters being distributed in Flint were effective for the reduction of lead, regardless of influent levels above the certification criteria of 150 micrograms/L (µg/L).

* NSF/ANSI 42, 53 and 401 are the leading industry standards for filtration products and systems.

Subsequently, filtered and unfiltered water grab samples were collected at each selected sampling location, generally at the kitchen faucet. Samplers recorded field observations including the filter type/brand, filter indicator status, and the resident’s estimate of the time since the filter or cartridge was installed. All samples were collected from the cold-water tap, and three types of 1000-mL samples were collected from homes:

1. Filtered Water, Existing Filter – First, one grab water sample was collected through the existing water filter at the home (if present).

2. Unfiltered Water – Second, an unfiltered water grab sample was collected after removing the existing filter or turning the by-pass valve on the filter. No cleaning or flushing took place prior to the water grab sampling.

3. Filtered Water, New Filter – Third, after the installation and flushing of a new filter or replacement filter cartridge for approximately 2 min, a grab sample was collected through the newly installed filter or filter cartridge.

Field Study Results

Unfiltered Water Samples – The maximum lead concentration in the unfiltered water at the 345 sampling locations in this study was 4,080 µg/L , with approximately 4% of the unfiltered water samples above 150 µg/L and over 37% above the Food & Drug Administration (FDA) standard for bottled water (5 µg/L).

Filtered Water Samples – Over 97% of filtered water samples contained lead below 0.5 µg/L. The maximum lead concentration in filtered water was 2.9 µg/L, well below the bottled water standard.

Removal of Additional Metals – The sampling showed incidental removal of copper, iron, manganese, and zinc despite the filters not being certified to remove miscellaneous metals.

In conclusiuon, POU filters proved to be a reliable option for the reduction of lead in this study. Faucet-mounted point of use filters can be an important barrier against unpredictable lead release from lead service lines and/or plumbing materials.

To ensure effectiveness, POU filters should be replaced per manufacturer recommendations.

Interested in what else you can do to help reduce exposure to lead in your drinking water?

Quick Tips:

  1. Use cold water for drinking, cooking, or making baby formula. Boiling your water will not remove lead from water. In fact, lead concentrations will increase because water evaporates during the boiling process.
  2. Before drinking water from the tap, flush your pipes by running the water faucet, doing a load of laundry, or taking a shower.
  3. Be sure that your faucets screen (aerator) is clean.

Technology Aims to Help States and Tribes Improve Water Quality Standard Public Hearings

States and tribes looking to maximize participation, simplify implementation and cut costs associated with public hearings are in luck. The U.S. Environmental Protection Agency (EPA) released a new resource that outlines 12 suggestions for how states and tribes can modernize the hearing process by implementing technology.

Under the Clean Water Act, states and authorized tribes are required to hold public hearings for the purposes of reviewing and adopting new or revised water quality standards. Because public participation is an important aspect of decision making on water quality standards, this new resource will be a great asset in increasing engagement within the community.

Modernizing Public Hearings for Water Quality Standard Decisions Consistent with 40 CFR 25.5

EPA’s document titled Modernizing Public Hearings for Water Quality Standard Decisions Consistent with 40 CFR 25.5 outlines ways to incorporate technology into public hearings while also continuing to meet federal requirements. The 12 suggestions in the document can help states and water quality standard-authorized tribes in two ways. For one, implementing technology in the hearing process will maximize opportunities for effective public input when it comes to water quality standard decision making. Secondly, incorporating such technology could facilitate in more efficient usage of spending resources by states and tribes.

Suggestions for Incorporating Technology into the Public Hearing Process

  1. Advertise online to help publicize the public hearing
  2. Use email lists to disseminate information to interested parties
  3. Post relevant public hearing materials online for easy access
  4. Conduct an in-person hearing while simultaneously broadcasting it via a web conferencing platform
  5. Conduct an online only public hearing using a web conferencing platform
  6. Use the internet to schedule witnesses in advance
  7. Encourage speakers to submit relevant materials or visual aids electronically in advance of the public hearing
  8. Allow unscheduled presenters to register to provide oral comments during an online public hearing
  9. Allow comments and questions to be made orally through a web conferencing platform
  10. Use a web conferencing platform’s chat/instant message feature
  11. Record the proceedings of the online public hearing
  12. Post the recorded public hearing online/on website

For a detailed description of each suggestion, please visit the online document file here.

Please note that these suggestions are not required and will not be imposed on any state or tribe. States and tribes have the choice to (or not to) incorporate any of these technologies into their public hearing process. In addition, there are also several factors that the EPA have considered in reference to these suggestions.

Considerations

  • The public’s accessibility to and acceptance of computers and the internet
  • The capacity of a state of water quality standard-authorized tribe to integrate and implement technology
  • The geographic scope of a water quality standard decision
  • The nature of a water quality standard decision
  • Presence of local decision-making or advisory boards
  • The state of water quality standard-authorized tribe’s overall public participation process
  • Public feedback on the integration of technology
  • Number of participants at each public hearing

Given that a large part of these suggestions are focused on online hearings, The EPA’s Modernizing Public Hearings document includes examples and milestones for planning an online hearing.

Here is the EPA’s milestone checklist, a super helpful tool to have handy when planning an online hearing.

Checklist provided by EPA for the implementation of technology in public hearings for water standards

As technology continues to evolve in the water industry, it’s certainly time for modern technological approaches to communicating to be implemented as well. So, what do you think?

For more information, please be sure to reference the EPA’s resource here. In addition, you can also contact the EPA directly with any questions.

Water and Wastewater Utilities: Be Hurricane Ready

As of June 1, hurricane season is in full effect through November 30. Areas along the Atlantic Coast, Gulf of Mexico, and the Hawaiian Islands are most vulnerable to hurricanes. As inhabitants within each of these areas take caution each year, it is equally important that water utilities do the same and become hurricane ready.

Due to heavy rainfall, inland flooding, and high winds of 74 mph or greater, hurricanes have the potential to cause serious damage to water and wastewater utilities. Some examples of the detrimental nature of hurricanes on water utilities include:

  • Pipe breaks that could lead to sewage spills or low water pressure throughout service areas
  • Loss of power and communication infrastructure
  • Combined sewer overflows (CSO)
  • Restricted access to facilities and collection/distribution system assets
  • Loss of water quality testing capability

The Environmental Protection Agency (EPA) has developed tools to help water utilities prepare for, respond to, and recover from hurricane related impacts.

satellite view of hurricane heading toward the east coast of USA

Preparing for Hurricane Season

Planning

  • Be sure your utility’s Emergency Response Plan (ERP) is up-to-date, and ensure all emergency contacts are current
  • Be sure utility staff is aware of all preparedness procedures by conducting trainings and exercises
  • Identify high-priority customers (such as hospitals), map their locations, and obtain contact information in the event of an emergency
  • Develop an emergency drinking water supply plan that may include bulk water hauling, mobile treatment units or temporary supply lines
  • Review historical records to understand the frequency and intensity of past hurricanes and how the utility may have been affected
  • In the event that you need to apply for federal disaster funding, complete pre-disaster activities. For example, taking photos of the facility to compare with post-damage photos

Coordination

  • Join your state’s Water/Wastewater Agency Response Network (WARN)
  • Get in touch with WARN members and other utilities to discuss ways in which help can be provided if needed. This includes outlining response activities and responsibilities; conducting full-scale exercises; obtaining resources and assistance; establishing interconnections between systems; establishing communication protocols to reduce misunderstandings
  • Coordinate with other key response partners, including your local EMA, to discuss potential points of distribution for the delivery of emergency water supply
  • Understand what your utility may be called on to do, as well as how local emergency responders and the local emergency operations center (EOC) can support your utility

Communication with Customers

  • Provide customers with materials that contain information on what they will need during a hurricane (i.e. information on water advisories and instructions for private well and septic system maintenance)
  • Distribute public information protocols with customers prior to a known storm (i.e. warnings that service disruptions are likely)
megaphone communicating news
Megaphone.

Facility and Service Area

  • Be sure to order and inventory existing equipment and supplies including:
    • Motors
    • Fuses
    • A two-week supply of chemicals
    • Cell phones and other wireless communication devices
    • Tarps/tapes/rope
    • Cots/blankets
    • First-aid kits
    • Foul weather gear
    • Flashlights/flares
    • Plywood
    • Sandbags
    • Bottled water
    • Batteries
    • Non-perishable food
  • Ensure that radios and satellite phones are working and fully charged
  • Develop a GIS map of all system components
  • Document pumping requirements, storage capabilities, and critical treatment components and parameters

Power, Energy and Fuel

  • Work with local power utilities to assure tree branches near power lines are trimmed
  • Inspect conditions, connections and switches of electrical panels
  • Document power requirements of the facility
  • Test generators regularly
  • Inform fuel vendors of estimated fuel volumes needed if utility is impacted
  • Reach out to local power providers to assure that your water utility is on the critical facilities list for priority electrical power restoration

Responding to a Hurricane – Pre-landfall Activities

Planning

  • Actively monitor hurricane activity

Facility and Service Area

  • Move equipment to water-tight facilities or out of flood-prone areas
  • Clear storm drains and set up sandbags to protect facilities
  • Be sure that back-up equipment and facility systems including controls and pumps are in worker order
  • Protect exposed lines or pipes that may be vulnerable during a storm
  • Fill storage tanks to full capacity and fill empty chemical storage tanks with water
  • Wastewater utilities should empty holding tanks, ponds and/or lagoons to prepare for an increase in flow

Personnel

  • Identify essential personnel and ensure they are trained to perform critical duties in an emergency
  • Establish communication procedures with both essential and non-essential personnel
  • Identify emergency operations and clean-up crews
  • Establish alternative transportation strategies if roads become impassable
  • Understand how limited staffing will impact response procedures if there are transportation issues or evacuations

Power, Energy and Fuel

  • Make sure vehicles and fuel tanks are filled to full capacity and ensure you can manually pump gas in the event of a power outage

Responding to a Hurricane – Post-landfall Activities

Coordination

  • Notify your local EMA and state regulatory agency of system status
  • Request or offer assistance through mutual aid networks, such as WARN, if needed
  • Assign a representative of the utility to the incident command post

Communication with Customers

  • Notify customers of any water advisories and coordinate with local media to distribute the message

Facility and Service Area

Overall

  • Assess the damage of the utility to prioritize repairs
  • Assure that back-up equipment and facility systems, such as controls and pumps, are in working order, and ensure that chemical containers and feeders are intact

Drinking Water Utilities

  • Inspect the utility and service area for damage
  • Ensure pressure is maintained throughout the system and isolate the sections where it is not
  • Control and isolate leaks in water transmission and distribution piping
  • Shut off water meters at destroyed properties
  • Monitor water quality
  • Notify regulatory agency if operations and/or water quality or quantity are affected
  • Utilize the pre-established emergency connections or create temporary connections to nearby communities as needed
  • If needed, implement plans to draw emergency water from pre-determined tanks or hydrants

Wastewater Utilities

  • Inspect the utility and service area for damage
  • Inspect the manholes and pipelines in flood-prone areas for inflow and infiltration after water recedes
  • Suspend solid waste processing during periods of high flow to conserve bacteria and prevent it from washing out of the plant
  • Notify regulatory agency of any changes to the operations or required testing parameters
waste water treatment plant

Documentation and Reporting

  • Document damage assessments, mutual aid requests, emergency repair work, equipment used, purchases made, staff hours worked, and contractors used to have open hand when applying for federal disaster funds
  • Work with local EMA on the required paperwork for public assistance requests

Personnel

  • Account for all personnel and provide emergency care, if needed
  • Deploy emergency operations and clean-up crews

Power, Energy and Fuel

  • Use back-up generators as needed
  • Plan for additional fuel needs in advance and coordinate fuel deliveries to generators
  • Stay in close contact with electric provider for power outage duration estimates

Recovering from a Hurricane

Coordination

  • Work with response partners to obtain equipment, funding, etc.

Communication with Customers

  • Be sure a utility representative is communicating with customers in reference to a timeline for recovery

Facility and Service Area

  • Complete damage assessments
  • Complete repairs, replace depleted supplies and return to normal service

Documenting and Reporting

  • Compile damage assessment forms and cost documentation into a single report to share, in addition to, state and federal funding applications
  • Create a ‘lessons learned’ document and/or after action report (AAR) to keep record of response activities
  • Revise budget and asset management plans

Mitigation

  • Identify mitigation and long-term adaptation measures that can prevent damage and increase utility resistance. Examples of successful mitigation projects by water and wastewater utilities include:
    • Providing protection to electrical substation and transformers that would be in danger of failing during floods, high winds and storm surges
    • Retrofitting sanitary sewer lift stations with electrical connections for portable generators
    • Elevating generators, fuel tanks and critical controls to protect from coastal storm surges
    • Replacing existing entry doors with heavy-duty impact-resistant doors

For more information on how to prepare for and respond to hurricane impacts and for a printable checklist to utilize within your water or wastewater utility, please visit the EPA’s site here.