A toilet is a necessary item we all use multiple times a day, and something we typically choose not to discuss. After all, who wants to talk about toilets — and why we need them. But that’s just what World Toilet Day aims to change.
On November 19, 2001, former construction industry executive Jack Sims founded the World Toilet Organization, and the inaugural World Toilet Summit was held in Singapore. Every year since then, we have celebrated World Toilet Day in an effort to bring awareness of the global santitation crisis, and to eliminate the taboo surrounding the subject of toilets and sanitation. Since its inception, World Toilet Day has gained the notice and support of many organizations in the private sector, civil society, and the international community, and was officially recognized by the United Nations in 2013.
Prior to the inception of World Toilet Day, the less than glamorous subject of sanitation received very little attention, and was therefore rarely prioritized on global development agenda. World Toilet Day aims to educate the international community on the risks associated with lack of sanitation as well as the urgency of implementing global sanitation. With that in mind, let’s look at some global sanitation statistics.
Global Sanitation Fast Facts
1 in 3 people — 2.5 billion of the world’s total population — lacks access to a clean and safe toilet
1 billion people practice open defecation
90% of diarrhea cases are caused by feces-contaminated food or water
Diarrhea results in the deaths of more than 700,000 children under the age of five every year
About 2,000 young children die as a result of diarrhea every single day
Every $1 spent on sanitation brings $5.50 in return by keeping people healthy and productive
Economic losses from lack of access to sanitation amount to an estimated $260 billion annually, more than the entire gross domestic product of Chile
Feces are responsible for more than 50% of the nine million preventable child deaths each year
Toilets have added 20 years to the human lifespan over the past 200 years
If everyone had access to a toilet, the estimated annual gain in economic productivity would be $225 billion
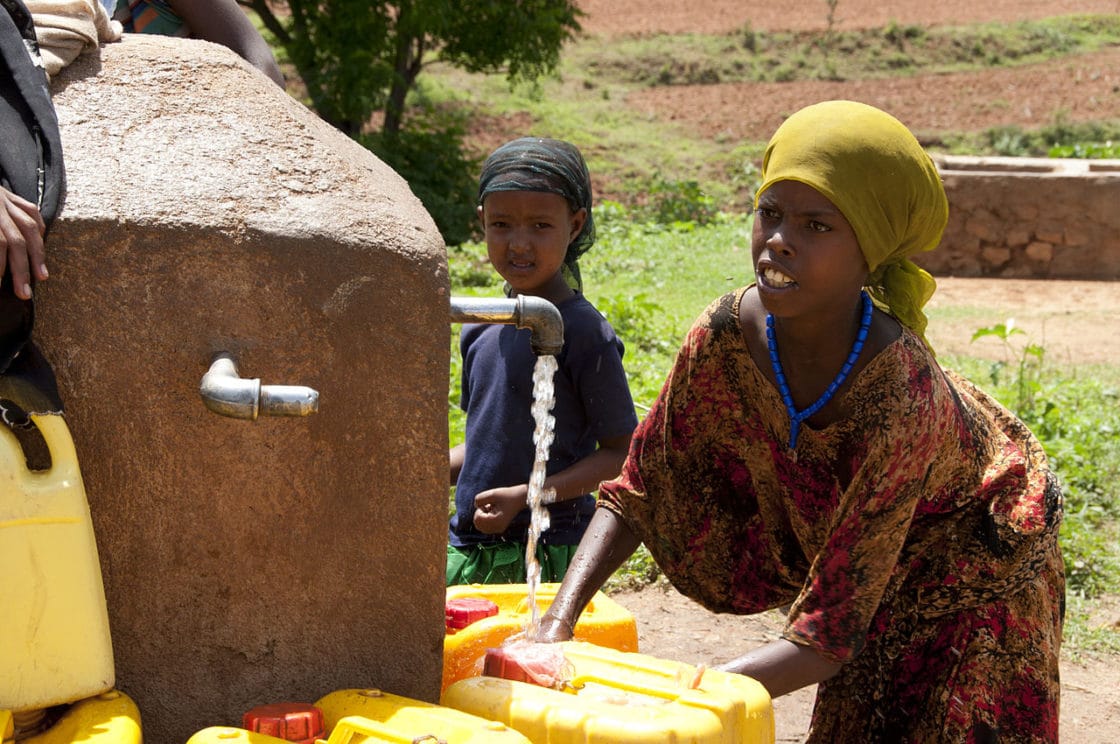
Lack of sanitation not only produces staggering health and economic consequences, but also has serious social implications, particularly for women and girls. Women who lack access to safe, private sanitation facilities are exponentially more susceptible to harassment and violence, and many girls who reach the age of puberty drop out of school if their school lacks adequate sanitation facilities. In general, children lose approximately 272 million school days due to diarrhea each year, with girls losing even more school days due to their familial role as water-gatherers in developing countries.
What We Can Do
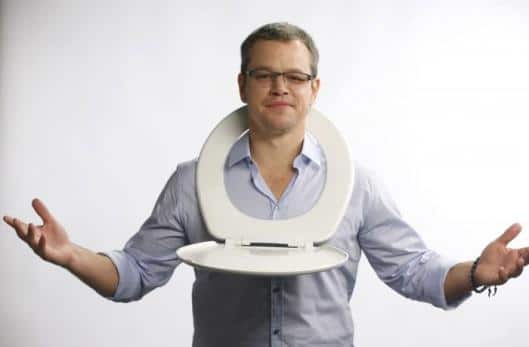
Matt Damon, co-founder of water.org, dons a (clean) toilet seat to spread awareness of the fact that the invention that has saved the most lives in human history is the toilet.
Fortunately, the World Toilet Organization and World Toilet Day have brought the sanitation crisis into the global spotlight, attracting the support of several high-profile charitable organizations such as charity: water, Water For People, WaterAid, and water.org, co-founded by Hollywood superstar and Massachusetts native Matt Damon. All of the above charities receive excellent ratings from Charity Navigator, with high percentages of their assets going directly to program expenses. In addition, the Bill & Melinda Gates Foundation has made global sanitation a targeted focus of its charitable works, with the Foundation committing $370 million to water and sanitation issues as well as hosting the Reinvent the Toilet Challenge in an effort to bring safe — as well as sustainable — sanitation to the global community.
In Conclusion
Global sanitation and hygiene are of paramount importance to the health and safety of billions of people, and also to the health of the global economy and environment. While the subject of sanitation has become less taboo and has gained more exposure through World Toilet Day and various charitable organizations over the past 14 years, we still have a long way to go. We can start by spreading the word through social media, news outlets, and word of mouth, and by supporting the charities that work so hard to provide safe, private sanitation to the entire global community. Together we can help bring health, safety, and dignity to the 1 in 3 people who still lack access to a basic toilet.
In 1986, United States President Ronald Reagan designated November 15 as National Philanthropy Day, a day which celebrates giving, volunteering, and charitable works, and the impact that philanthropy makes on our society. National Philanthropy Day celebrates philanthropy, which etymologically translates to “love of humanity,” each November 15 in an effort to turn the word into action and to recognize the change that word has brought to our local and global communities.
National Philanthropy Day is now overseen by the Association of Fundraising Professionals, who entreat people to follow the five Ps of giving in order to make the most impact:
Passionate. With literally thousands of charities and causes from which to choose, it is critical to support a select few about which you are passionate. The more passionate you are about a cause, the more likely you are to fully invest in it, including not just money, but time.
Proactive. Once you’ve determined which type of cause you would like to support, proactively find a charity dedicated to the cause.
Prepare. Do your research. Not all charities are created equal, and you want to be sure that the charity you are supporting is fiscally responsible and well managed. Both Charity Navigator and Charity Watch are excellent resources for investigating all aspects of charity ratings.
Plan. Create a plan of giving action so that you hold yourself to a certain dollar and time amount. Charities typically receive most of their donations in the last quarter of the year, while struggling in the spring and summer. Find out what makes the most sense for the charity you have chosen to support and put a specific plan in place — and stick to it.
Powerful. Now that you are ready and committed to give, ensure that your donation is powerful; meaning give the most you can, in both time and money.
At Tata & Howard, we are passionate about improving the environment in which we live through our work — and works. As a corporation, we have followed the five Ps of giving and have partnered with select charities in an effort to support them fully. Water For People has been Tata & Howard’s charity of choice since 2005, with employee-owners donating directly from their paychecks and the company matching 100% of every dollar donated. In addition, Tata & Howard sponsors the CTAWWA Water for People Golf Tournament in the fall. Water For People strives to provide safe, sustainable drinking water for everyone, forever. According to Water for People, they exist for one purpose, and it’s as simple as their name: they want all people to have safe, continuous water, and when they do, their job will be done.
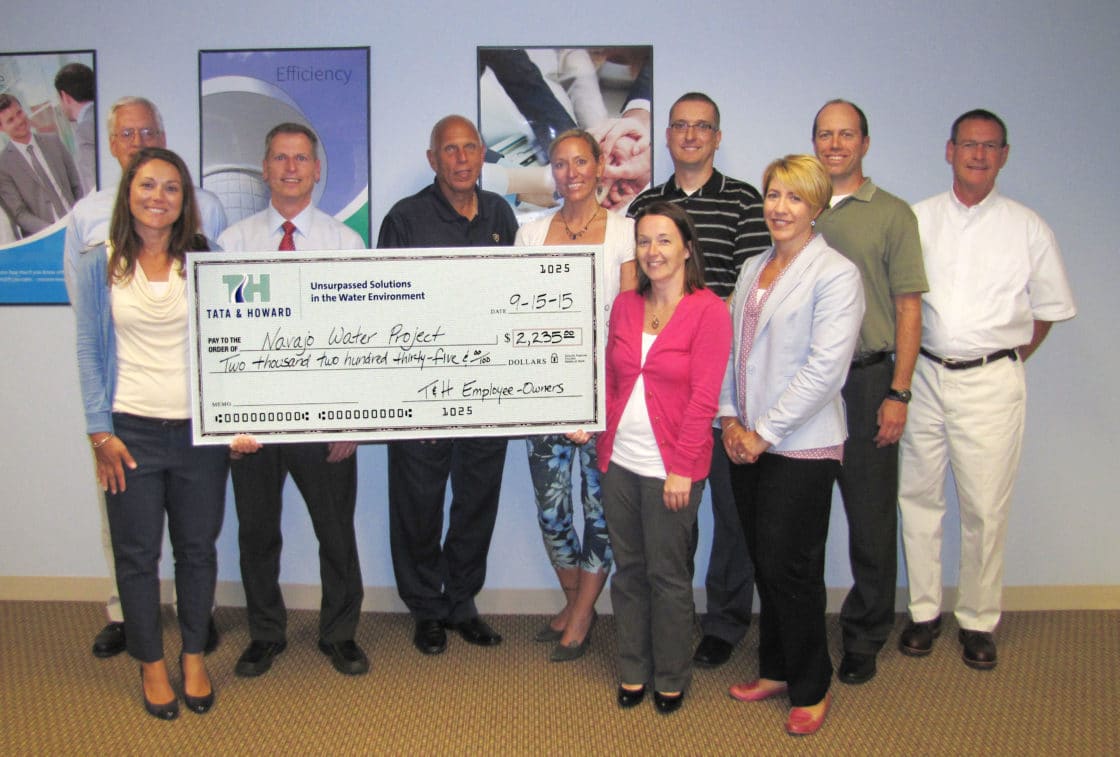
Tata & Howard employee-owners helped support the Navajo Water Project
This past year, Tata & Howard selected another key charity to support after learning of the plight of the Navajo on American soil. This year, Tata & Howard donated $2,235 to Navajo Water Project, a subsidiary of DIGDEEP that works to provide safe, accessible drinking water to Native Americans living in Navajo Nation. While there are dozens of water charities supporting developing countries, Navajo Water Project is the only water charity that serves people living in the United States.
Each Thanksgiving season, Tata & Howard employee-owners participate in a food drive for the Worcester County Food Bank (WCFB). WCFB is central Massachusetts’ leading anti-hunger organization distributing over five million pounds of donated food and grocery product in partnership with food donors, financial supporters, and volunteers. This year, Tata & Howard employee-owners collected and donated over 400 pounds of food for WCFB during the month of October.
Every December, Tata & Howard partners with Dare Family Services to provide personalized gifts to disadvantaged children. Employee-owners choose wish ornaments from a giving tree and purchase the gifts for which the children ask. All unclaimed wishes are purchased by Tata & Howard’s Philanthropy Committee — a robust, in-house committee that raises and distributes funds to charities — ensuring that every child receives his or her requested gifts. Dare Family Services’ primary mission is to find, train, and support loving homes that will help children become resilient and overcome the trauma of serious abuse and neglect. Every child is given a life, education, and a road to normal adulthood.
In addition to Tata & Howard’s partner charities, employee-owners support their own chosen charities, often with support from the company’s Philanthropy Committee. Employee-owners have supported such worthy causes as Special Olympics of Massachusetts (SOMA), Dana-Farber Cancer Institute, Camp Sunshine, and Livestrong. And Tata & Howard employee-owners don’t just write checks — they also donate significant amounts of time, like coaching SOMA, running for the Jimmy Fund, competing in the Tough Mudder Challenge to support Wounded Warrior Project, riding in the PanMass Challenge, training dogs for NEADS/Dogs for Deaf, and skiing for hear ME now.
National Philanthropy Day is a grassroots movement to increase public awareness of the importance of philanthropy, and to provide information on giving and volunteering so that people can practice efficient philanthropy. It is also the ideal day to reassess charitable giving, from both a corporate and individual level. As John Rockefeller stated, “Think of giving not only as a duty but as a privilege.” At Tata & Howard, we feel truly privileged to be able to support our corporate and individual causes, and believe that each and every act of charity has significant impact that helps to make the world a better place. Happy National Philanthropy Day!
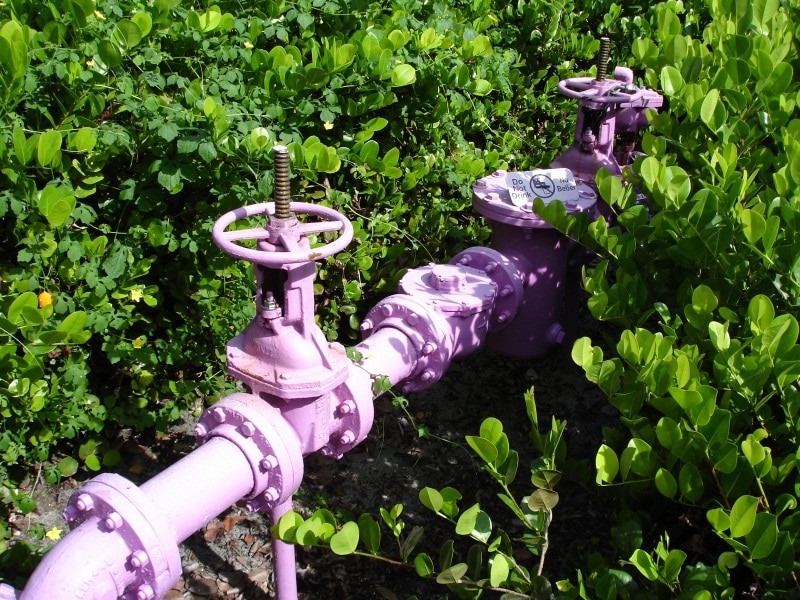
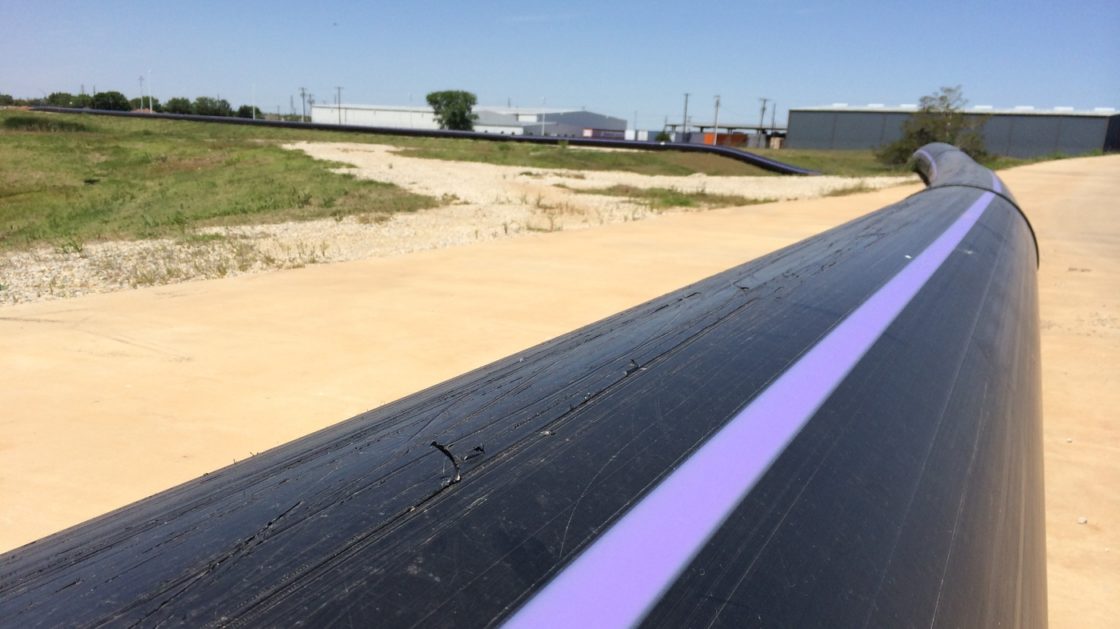
Purple pipes, such as these used in Collier County, Florida, indicate usage of non-potable reclaimed water
Reclaimed water, or recycled water, is wastewater that has been treated to remove all solids, bacteria, and pathogens. Most often it is used for recharging groundwater supplies, for industrial purposes such as cooling towers, for agricultural and commercial irrigation, and for firefighting, and its use is increasing exponentially, with purple pipes dotting the landscape of our nation. Recycled water is also being used in some incredibly creative ways, and we’ve highlighted five innovative uses for reclaimed water below.
Algae
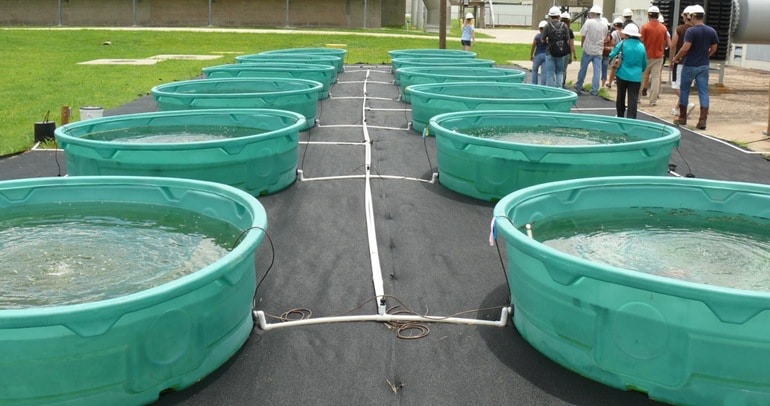
Algae are considered a potent source of biofuel and are also used extensively in the cosmetics and nutritional supplements industries. Since growing algae commercially requires chemical fertilization, it is frequently considered unviable and prohibitively expensive. Chemical fertilizers significantly cut into profits and they are also needed for more crucial crops, making traditional algae growth unsustainable. Fortunately, some scientists from Rice University in Houston, Texas have found a way to grow algae in municipal wastewater. The wastewater already contains lots of natural, free fertilizer, and the algae actually help to purify the water.
Algae grows in pools of wastewater in Houston, TX (photo: Rice University)
In the study, the scientists found that strains of choice, valuable, oil-rich algae grew and thrived in open-air pools of municipal wastewater that had previously undergone solids removal, while at the same time removing more than 90% of nitrates and 50% of phosphorus from the wastewater. Typically, when too many nitrates and phosphorus remain in treated wastewater, environmental issues such as algae blooms and drinking water contamination can occur. And since there is currently no cost-effective way to remove large quantities of nitrates or phosphorus from water, growing algae in wastewater actually provides significant benefit to municipal wastewater treatment plants. It’s a win-win.
International Space Station
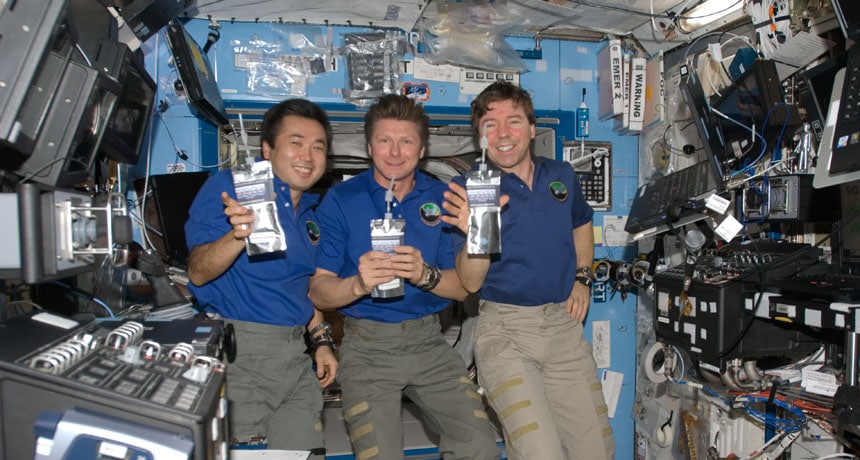
93% of all water on board the International Space Station (ISS) is reclaimed from several sources, including breath and sweat condensate, shower runoff, urine from animals — and, on the American side of the station, multi-national human urine. You see, the Russians don’t recycle their urine, but the Americans do. And, not wanting to waste any resources, the Americans also collect urine from the Russian side and purify that as well.
Astronauts drink water made from recycled urine and other wastewater aboard the International Space Station (photo: NASA)
“It tastes like bottled water,” said Layne Carter, water subsystem manager for the ISS at NASA’s Marshall Space Flight Center. “As long as you can psychologically get past the point that it’s recycled urine and condensate that comes out of the air.”
Not only do the Americans and Russians disagree on urine reclamation, they also disagree on purification methods. The Russians utilize silver in its ionic form, and Americans use iodine, although there are plans to switch to silver since it doesn’t need to be filtered from the water prior to consumption. However, Carter believes it is smart for the two nations to employ differing purification methods aboard the station.
“It really makes a lot of sense to have dissimilar redundancies in the space station in case one of the systems has problems,” noted Carter.
The ISS does keep around 2,000 liters of backup water in case of an emergency, but Americans don’t want to take any chances. Speaking on recycling their Russian colleagues’ urine, Carter explains, “We collect it in bags, and then the crew hauls it over to the US side. We don’t do 100% of the Russian urine. It depends on our time availability.”
Canadian astronaut Chris Hadfield produced a video while he was on board ISS in 2013, and in it he defends the consumption of reclaimed water, including urine.
“Before you cringe at the thought of drinking your leftover wash water and your leftover urine, keep in mind that the water that we end up with is purer than most of the water that you drink at home,” he said. “That makes the International Space Station its own self-contained environment. That’s a critical step towards living for long periods off of planet Earth.”
Drinking Water
Wichita Falls, Texas constructed a 12.5-mile pipeline to deliver the City’s treated wastewater directly to its drinking water treatment plant (photo: Shelley Kofler)
Last year, the then drought-stricken city of Wichita Falls, Texas built a 12.5-mile pipeline that connected its wastewater treatment plant directly to the Cypress Water Treatment Plant, where wastewater was purified into drinking water. At the time, Wichita Falls was suffering from its worst drought on record, with its lakes hovering at an alarming 23%, and the wastewater treatment plant supplied anywhere from 30-50% of demand per day. And while some residents initially opposed the idea, they quickly adapted to the idea of drinking recycled water — after all, there was little choice.
“The water coming out of our wastewater treatment plant is actually cleaner than the lake water it will be mixed with,” said Daniel Nix, Utility Operations Manager for the City of Wichita Falls. He added that the wastewater is highly treated through a four-step process prior to being piped to the drinking water treatment plant where it is then mixed with lake water — and highly treated again.
In July, Wichita Falls was able to stop supplementing its drinking water supply with treated wastewater, as much of Texas experienced heavy rains in the spring that restored lakes and reservoirs almost to capacity. The City now has a drought-proof backup plan that will allow residents and officials to rest a little easier.
Beer
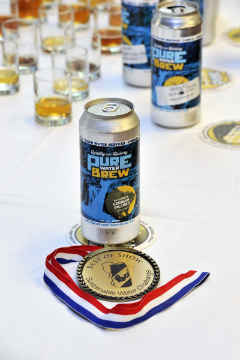
Dean Ehnes’ German Pilsner won Best In Show (photo: Mark Jockers)
A very adventurous group of home beer brewers known as the Oregon Brew Crew received approval from the state of Oregon to utilize 100% recycled sewage water to brew beer for its 2015 Sustainable Water Challenge/Pure Water Brew competition. Clean Water Services, a wastewater treatment utility that serves the Portland, Oregon metro area, supplied 300 gallons of reclaimed water from its Forest Grove facility to 25 Oregon Brew Crew members in June, and the home brewing enthusiasts set to work. The competition was held on August 29 at the Raccoon Lodge and Brew Pub in Beaverton, Oregon, with Dean Ehnes winning Best In Show, and the grand prize of $100, for his German Pilsner. Ehnes’ brew, along with the other winners, were showcased at the WateReuse Symposium in Seattle and the Water Environment Federation Conference in Chicago, both held this past September.
Although the Oregon Brew Crew received approval to use reclaimed water for their homebrew competition, direct potable reuse is prohibited in Oregon. Many proponents of recycled water usage would like to see that change, and think craft beer is one of the quickest and easiest ways to capture the public’s attention and support. Clean Water Services utilizes advanced treatment processes including ultrafiltration, reverse osmosis, and advanced oxidation to ensure the water is clean and pure.
Mark Jockers, a spokesman for Clean Water Services, stated, “We need to be judging water by its quality, and not by its history. The water we’re producing is significantly cleaner than what the safe drinking standards are for water that comes out of taps across the United States.”
And when it comes to the “yuck factor” associated with water reuse, Zachary Dorsey of the WateReuse Association, a nonprofit that supports water recycling, sums it up nicely: “We all live downstream from someone.”
NFL Football
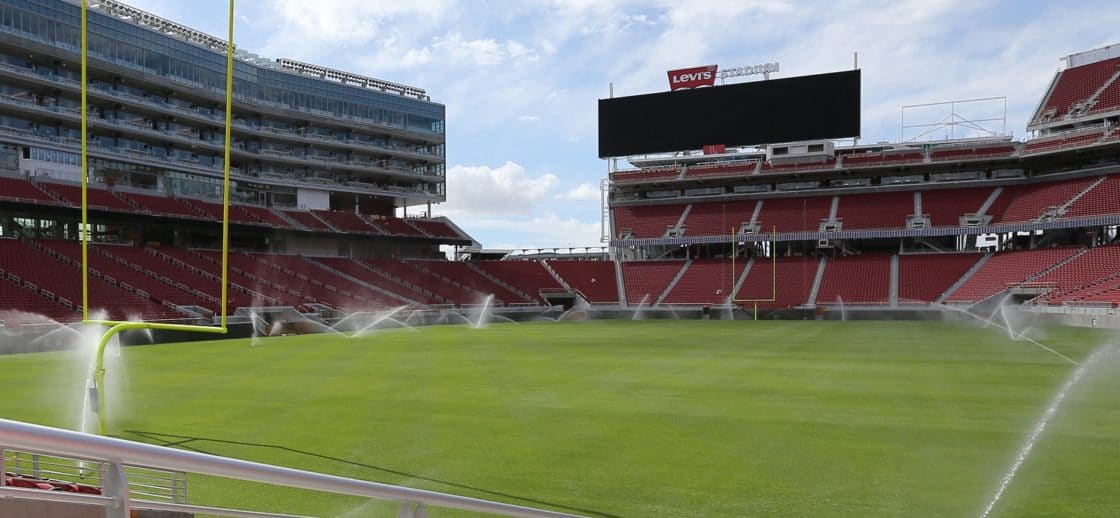
San Francisco 49ers’ Levi’s Stadium utilizes recycled water to irrigate its playing field (photo: www.levisstadium.com)
With California in the midst of one of the worst droughts in its history, it’s no surprise that Levi’s® Stadium, the new stadium for the San Francisco 49ers, is the first NFL stadium to receive a LEED Gold rating from the U.S. Green Building Council. Opened in 2014, the stadium boasts such green features as a 27,000 square foot green roof, energy efficient systems, solar power, and the use of almost exclusively recycled construction materials. Recycled water also plays a huge part in the stadium’s sustainability, with about 85% of all water use coming in the form of recycled water from the City of Santa Clara Water and Sewer Utilities. The reclaimed water is used for playing field irrigation, flushing toilets, cooling towers, and of course, watering the enormous green roof!
The stadium has been very well received, and sets a high bar for other stadiums across the nation to follow suit. Unfortunately for 49ers football fans, the stadium has not helped their team, who is currently in dead last place in the NFL standings.
In Conclusion
As we continue to face ever increasing challenges on our water supply including higher demand, failing infrastructure, population growth, climate change, and drought, individuals and communities are increasingly viewing wastewater as a resource rather than a waste product. Continuing to find unique and practical applications for water reuse will both foster greater public acceptance and protect our most precious resource, paving the way for a sustainable future — a benefit on which we can all agree.
A common problem facing municipal water systems today is the need to maintain safe water supplies in the midst of increasing demand, limited supply, crumbling infrastructure, decreasing budgets, dwindling governmental funding, and more stringent regulations. Never before have municipal suppliers been faced with such a daunting task, and utilities are scrambling to find ways to make ends meet. And while there are technologies today that are more efficient than the decades-old systems still in use at many facilities, most utilities simply do not have the resources to upgrade in light of limited local, state, and federal funding and budgetary constraints.
Fortunately, there are many steps that municipal water systems can take to increase efficiency without having to upgrade entire facilities and piping systems. Implementing a few comparatively inexpensive initiatives can save utilities significant, much-needed funds that can be used for future upgrades required for regulatory compliance.
Business Practice Evaluations
North Chelmsford, MA water treatment plant interior
Very often, operational procedures of municipal water systems are overshadowed by the need to provide safe, clean drinking water to the public, and understandably so — the dedication that water utilities show to their customers is commendable. However, the fact remains that operational procedures typically have the potential for drastic improvement, resulting in reduced operational expenses and smoother utility management.
One way to address operational inefficiencies is with a Business Practice Evaluation (BPE), which assesses the health of a utility’s work practices by implementing a framework for a structured approach to managing, operating, and maintaining in a more business-like manner. In other words, approaching a municipal water supply as a for-profit business rather than as a public supplier results in better operational and managerial procedures, and an improved bottom line.
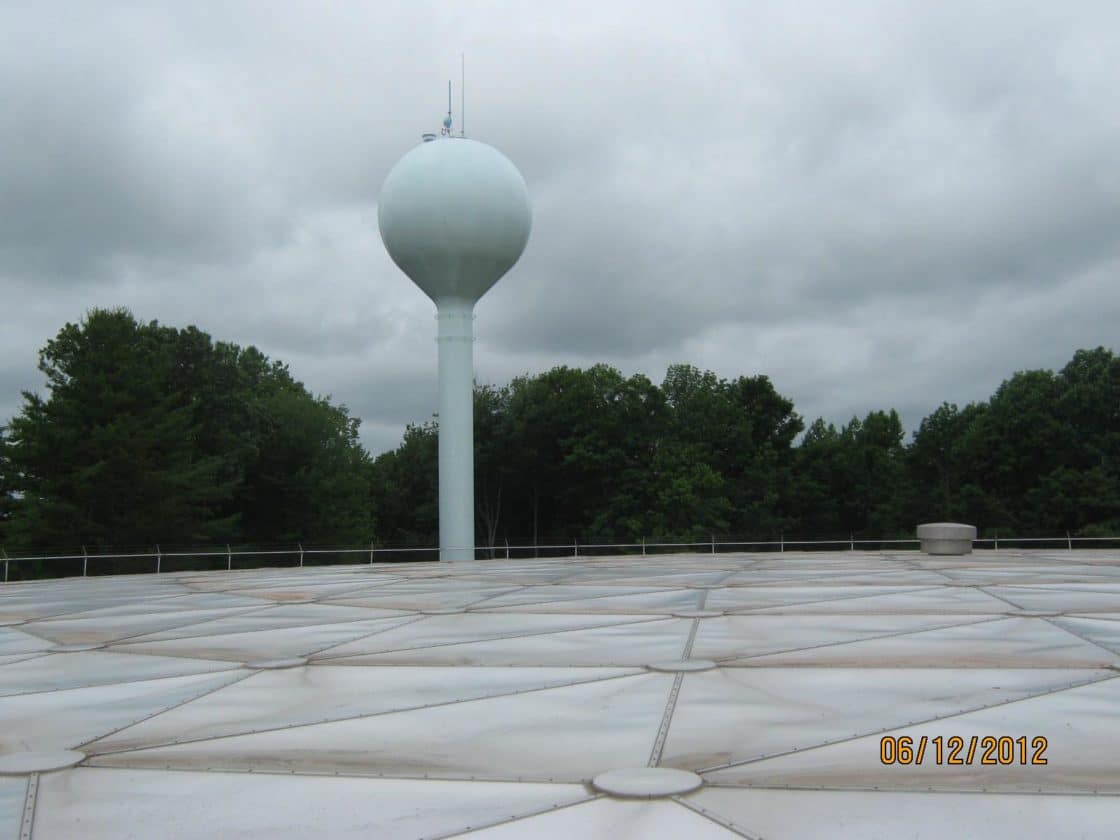
Water storage tank in Meriden, CT
The overall goal of the assessment process is more efficient and effective work practices, and the assessment includes documentation of current business practices, identification of opportunities for improvement, conducting interviews including a diagonal slice of the organization, and observation of work practices in the field.
This assessment provides a birds-eye view of the utility along with objective recommendations to improve system performance. As no two utilities are alike, the structured approach is fully customized and includes all functions of the utility — from administration and technical to operations and maintenance. The result is an organized, systematic plan and timeline to optimize the overall utility by implementing specific steps including developing rating criteria to determine level of performance of work practices; conducting kick-off, consensus, and findings workshops; reviewing utility documents and documentation of work practices; conducting interviews with employees; and observing field operations of current work practices.
Organizations that have conducted a BPE significantly improve the operational efficiency of their utility, and the evaluation typically pays for itself in well under a year.
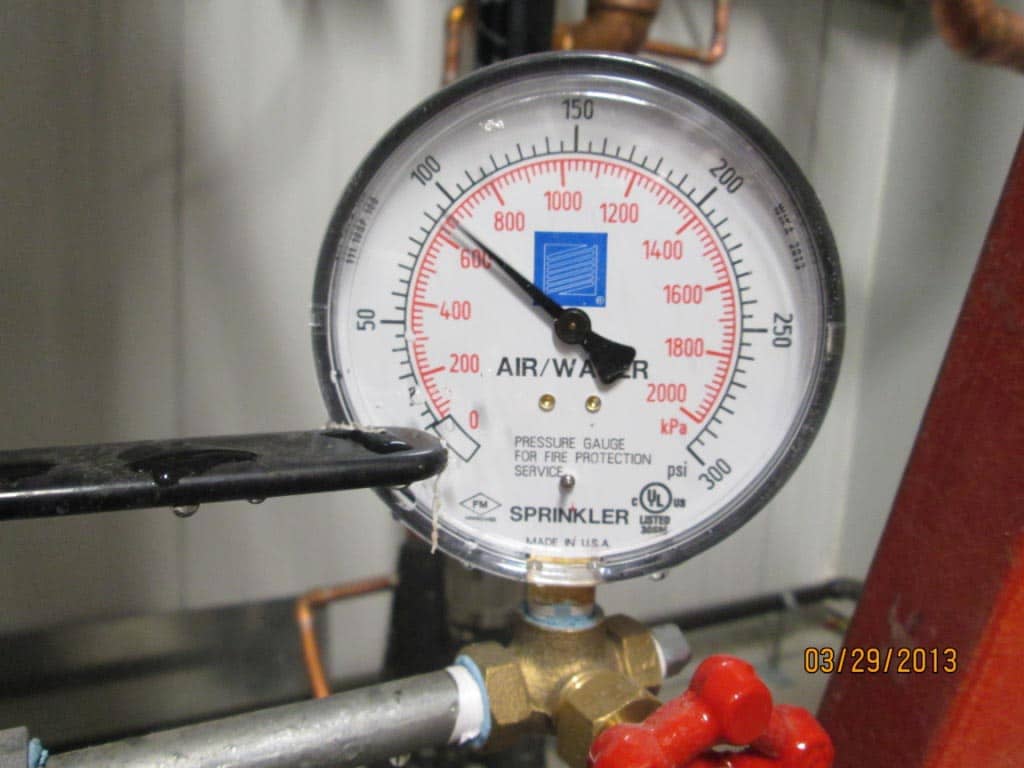
Non-Revenue Water and Water Audits
Besides improving operational efficiency, utilities of today need to find ways to reduce non-revenue water. Non-revenue water is water that has been pumped but is lost before it ever reaches the customer, either through real — or physical — losses such as leaks, or through apparent losses such as theft or meter inaccuracy. Globally, water utilities lose 34% of their supply to non-revenue water, and in the United States, that number is about 20%, with 75% of that loss being easily recoverable. Because non-revenue water is both detrimental to the financial health of a utility as well as our nation’s limited water resources, the AWWA recommends that utilities conduct annual water audits using M36: Water Audits and Loss Control methodology to accurately account for real and apparent losses.
Tata & Howard Vice President Steve Rupar, P.E., served as co-chair of the South Central Connecticut Regional Water Authority (RWA) Non-Revenue Water Goal Team, which completed the first water audit of the RWA system based on the AWWA M36 third edition methodology in 2010. Recently, Mr. Rupar was part of the AWWA Water Loss Control Committee and in charge of writing two new chapters on apparent loss control for the 4th edition update to AWWA M36.
A water audit can help water systems identify the causes and true costs of water loss, and develop strategies to reduce water loss and recapture lost revenue. In the northeast, drinking water infrastructure is typically several decades old, sometimes over a century, and deteriorating distribution systems can be a significant source of water loss through leakage. In addition, policies and procedures that lead to inaccurate accounting of water use along with customer metering inaccuracies also contribute to NRW. Of the estimated $200 billion that the United States will need to spend over the next 20 years to upgrade water distribution systems, almost half of that is needed for water loss control.
Water audits are often the most cost-effective and efficient solution to increasing demand. And like BPEs, the cost of a water audit is typically recovered in under a year. Effective water loss control programs significantly reduce the need for costly facility upgrades, and the recovered water can be sold to consumers, generating desperately needed revenue while meeting water demands. Another benefit of a water loss control program is the reduction of entry points for disease-causing pathogens, resulting in increased public health.
In Conclusion
Municipal water systems of today face a number of significant challenges including water quantity and quality concerns, aging infrastructure, population growth, increased regulatory requirements, climate change, and depleted resources. In order for water systems to remain profitable, and therefore functional, they must implement efficiencies that will increase revenue and decrease water loss, all with the least capital expenditure possible. Both BPEs and water audits are inexpensive ways to improve efficiency and to realize a return on investment in less than one year, saving limited funds for future upgrades and expansions.
The ESOP Association and its member companies have been celebrating Employee Ownership Month every October for over 20 years. The month-long observance aims to celebrate the myriad benefits of employee stock ownership plans (ESOPs) through employee education and team-building events. Tata & Howard celebrated for the first time this year, as October 2015 marks the one-year anniversary of the company becoming a 100% employee-owned company. Throughout the month, T&H employee-owners have been participating in contests, calls to action, and special events in order to celebrate not only ESOP Month, but also the first anniversary.
What is an ESOP?
An ESOP is a program that provides a company’s workforce with an ownership interest, most frequently at no up-front cost to employees. ESOPs are implemented for different purposes, often as a way to provide for the future transfer of ownership of a successful, closely-held private company from owners to employees.
In the United States, ESOPs are a defined contribution plan, which is a form of retirement plan. ESOPs are regulated by Employee Retirement Income Security Act (ERISA), a federal law that establishes minimum standards for retirement plans in private industry and extensive rules on federal income tax effects of employee benefit plans. ERISA was enacted in 1972 to protect the interests of employee investment plan participants.
Infographic by National Center for Employee Ownership (NCEO) from What Is an ESOP?
ESOP Statistics
According to the ESOP Association, ESOPs provide many benefits to employees, some of which are highlighted below:
There are approximately 10,000 ESOPs in place in the U.S., covering 10.3 million employees (10% of the private sector workforce).
About 330 ESOPs (3%) are in publicly traded companies.
An estimated 7,000 of the 10,000 companies have ESOPs that are large enough to be a major factor in the corporation’s strategy and culture.
Approximately 5,000 ESOP companies are majority-owned by the ESOP.
Approximately 4,000 are 100% owned by the ESOP.
At least 75.4% of ESOP companies are or were leveraged, meaning they used borrowed funds to acquire the employer securities held by the ESOP trustee.
Of the 10,000 employee-owned companies nationwide, fewer than 2% were financially distressed when they established their ESOP.
Approximately 99% of ESOP Association members are private, closely-held companies.
ESOPs exist primarily in small businesses – 68% of Association members have less than 250 employees.
While ESOPs are prevalent in a broad range of industries, approximately 23.4% of Association members are in manufacturing, followed closely by construction (15.3%) and engineering (10.9%).
Approximately 65% of ESOP Association members report that their ESOPs have been in place for 10 years or more.
4% of Association members have companies that are more than 50% owned by the ESOP.
6% of Association members offer a supplemental benefit plan in addition to the ESOP including, 401(k) plans, pension plans, and profit sharing plans.
Research indicates that ESOP implementation results in more information sharing, increased communications, and involvement in decision making for employee owners.
3% of ESOP Association members report that motivation and productivity increased as a result of the ESOP.
Savings from the low layoff rate of ESOP participants was $1.9 billion in 2014, showing that ESOP companies are an investment worth noting.
GSS figures released in June 2015 found that 1.3% of employees with employee stock ownership, which includes the ESOP model and other forms of employee ownership, said that they were laid off in the last year compared to a 9.5% rate for employees without employee stock ownership.
T&H employee-owners participated in a bubblegum chewing contest
Contrary to some rumors, ESOPs are not typically formed in an attempt to save a struggling company. In fact, the vast majority of ESOPs are formed by highly successful companies. The ESOP only helps to increase company success as it provides incentive for employees to ensure that the company remains prosperous. Employee-owners of ESOPs typically know more operative and financial information about their company than do employees of traditionally held private corporations, and are often more motivated and productive. After all, the more successful the company, the more financial reward to employee-owners.
Tata & Howard’s ESOP Celebration
This month, employee-owners at Tata & Howard have been immersed in ESOP fun and education. To date, employee-owners have participated in a “Guess the Share Price” contest, a “Guess the Labor Revenues per Employee” contest, a bubblegum chewing contest, a hike, and an ESOP Slogan contest. In addition, employee-owners have been treated to chocolate coin bags, Starbucks coffee breaks, and ice cream socials, and have participated in charitable activities such as a month-long food drive and a special donation to Water For People.
T&H employee-owners received their first share certificates on October 19, 2015
Celebrating the 23rd anniversary of Tata & Howard on October 19, 2015, Tata & Howard employee-owners received their first ESOP share certificates, and proved that they are ready for 23 more. Results from an anonymous survey show that Tata & Howard employee-owners overwhelmingly support the formation of the ESOP, and they have also embraced and conquered fun and educational challenges. The shift to an ESOP has been a positive change for Tata & Howard, and we look forward to many more celebratory Octobers. Happy ESOP Month!
Manhole covers can be found in cities throughout the world, and are typically not given a second thought. After all, these unobtrusive, circular covers lead to underground infrastructure, which to most people is out of sight, out of mind. But manhole covers can actually be attractive and interesting, and are sometimes custom-designed and even whimsical. They also have an extensive history.
Beginning around 3500 BCE, stone slabs or wood pieces were first used to provide access to covered trenches that carried sewage away from cities, and this basic design was utilized until around 1850 CE, when the modern manhole was developed to provide access to then-emerging water and wastewater infrastructure. Since that time, manhole covers, which are typically round and weigh up to 300 lbs. each, have been manufactured from cast iron and haven’t changed much.
While many manhole covers are basic, with either no verbiage or a one word, generic label such as “sewer,” there are some unsung treasures throughout the country that are quite eye-catching. Below, we have listed 25 unique manhole covers from all areas of the country, and we encourage you to also go “drainspotting” the next time you find yourself walking city streets. You may be surprised at what you find, so be sure to let us know in the comments if you find any unusual or interesting covers. Enjoy!
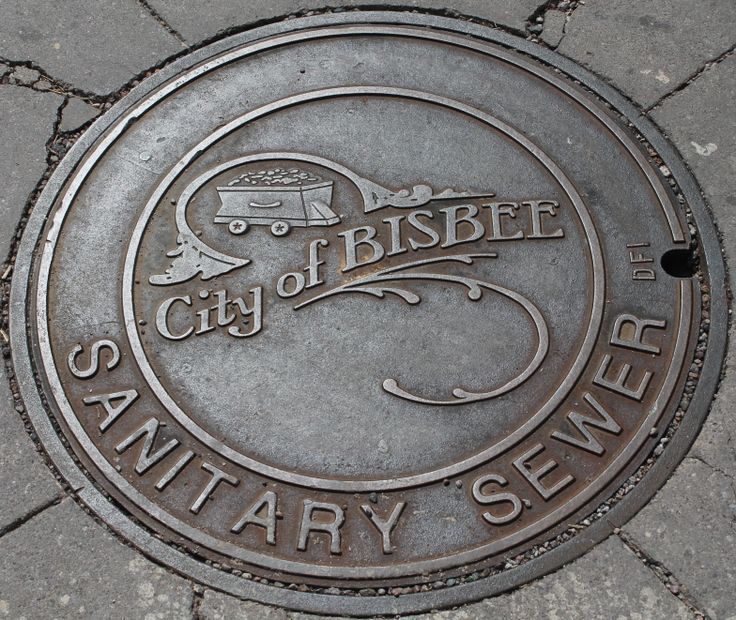
This manhole cover from gold mining town Bisbee, Arizona features a mining cart filled with gold nuggets
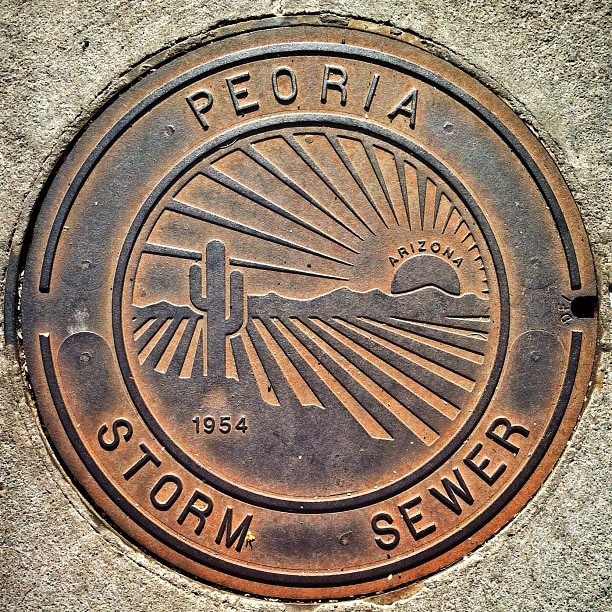
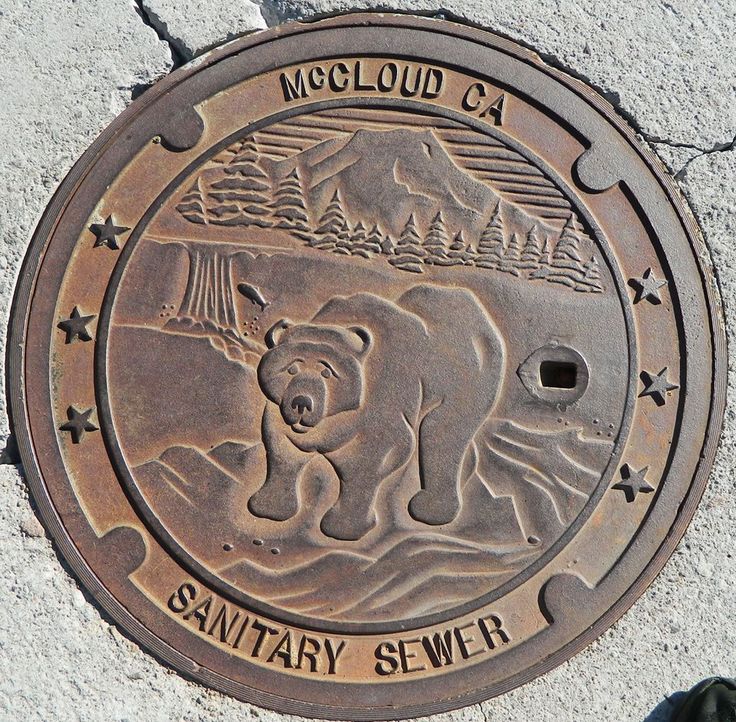
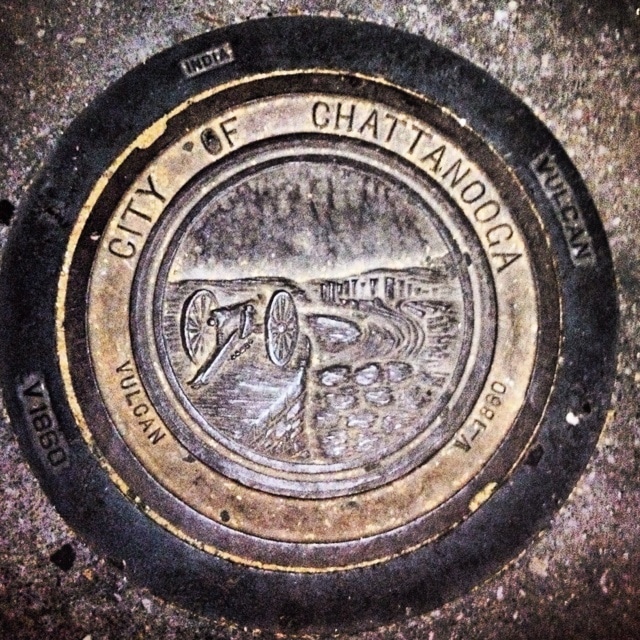
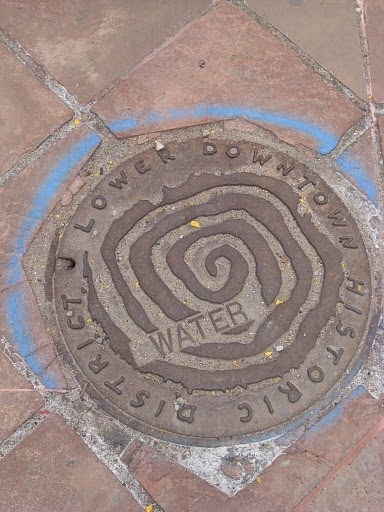
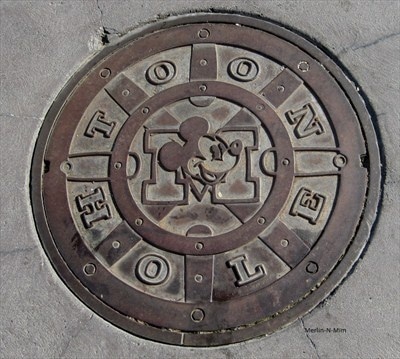
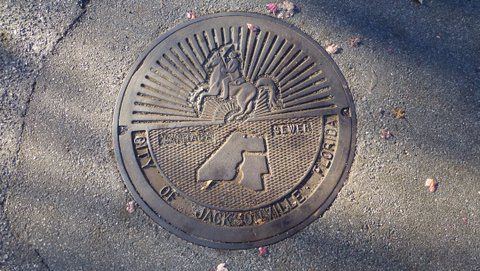
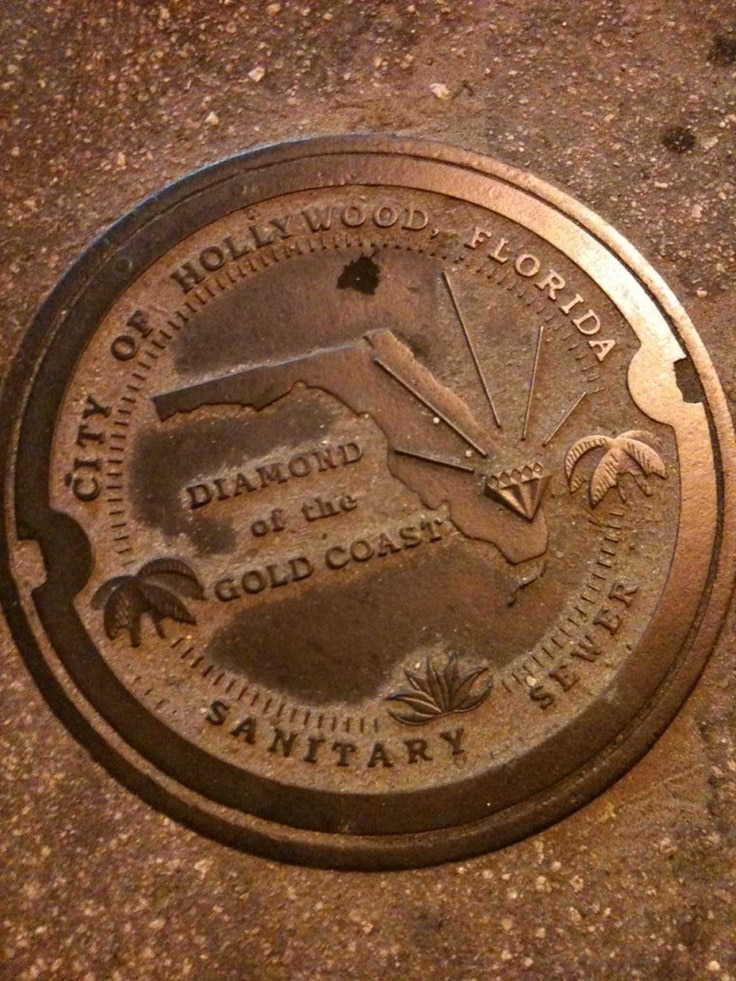
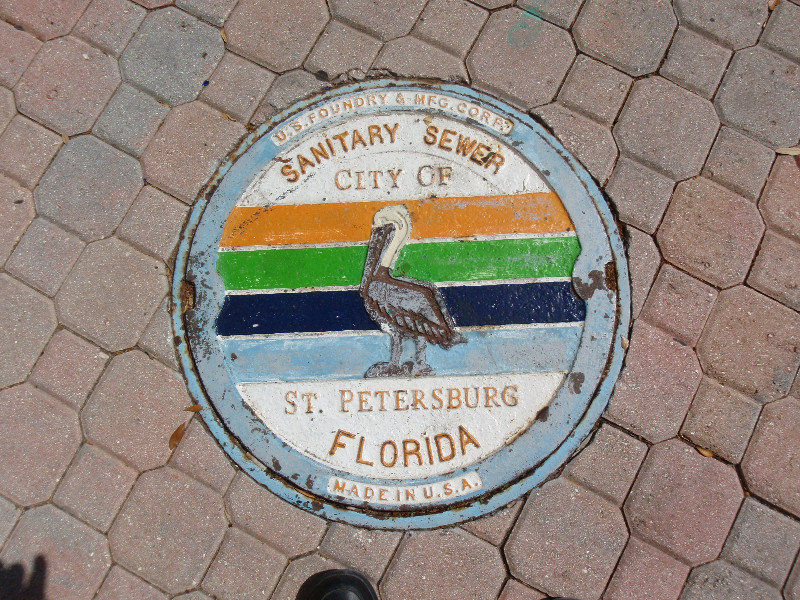
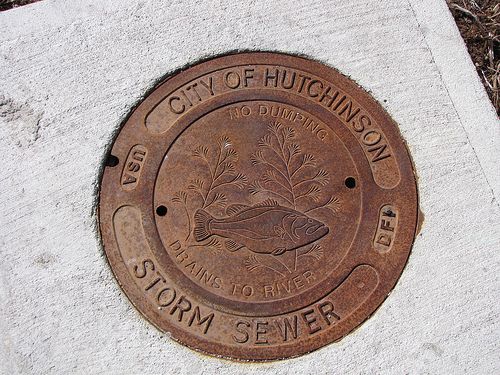
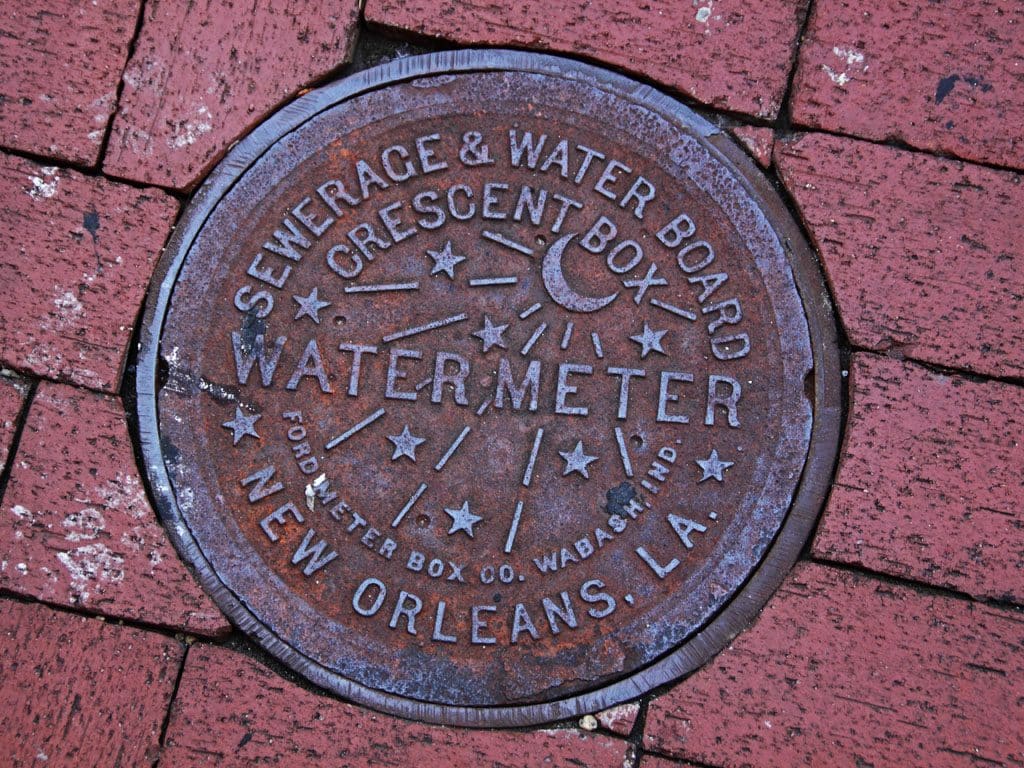
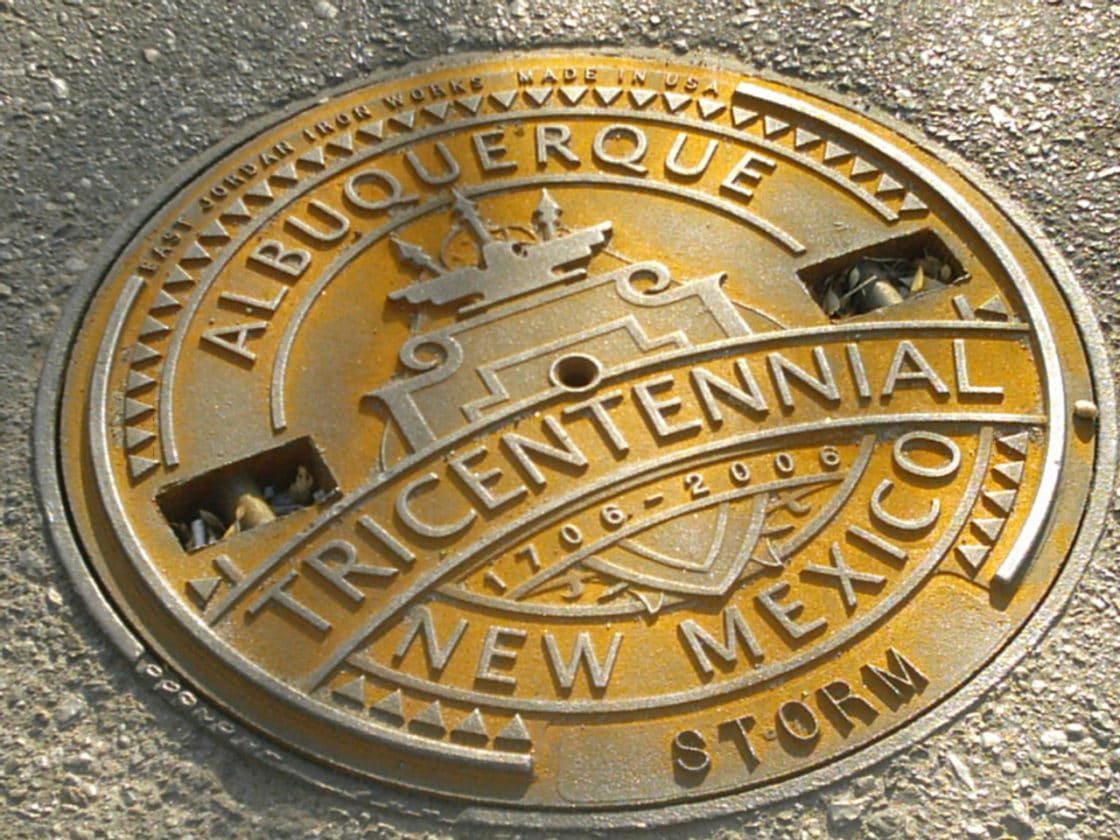
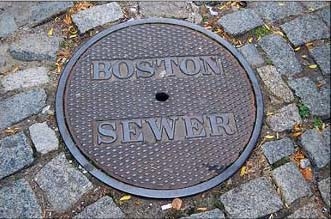
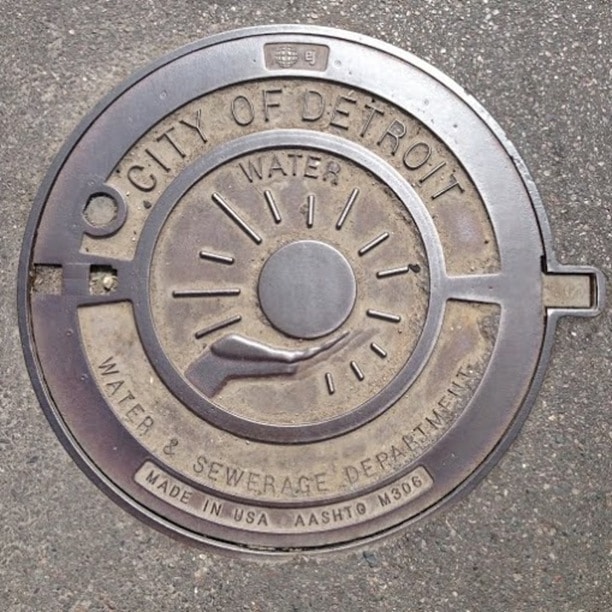
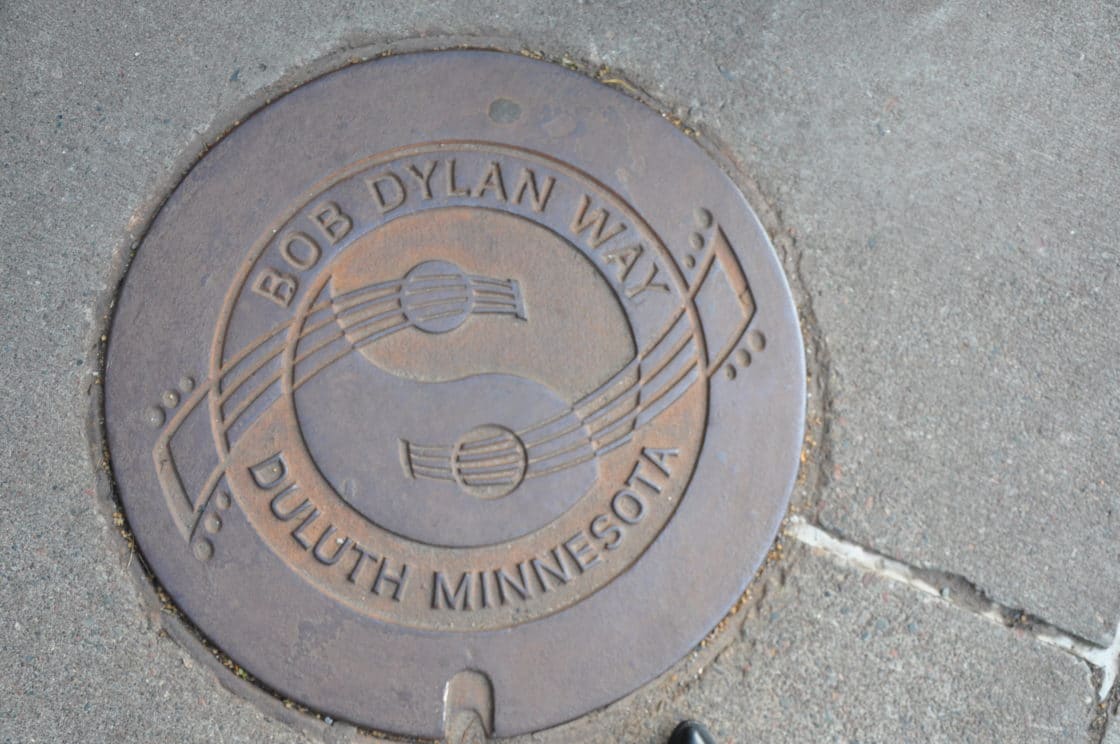
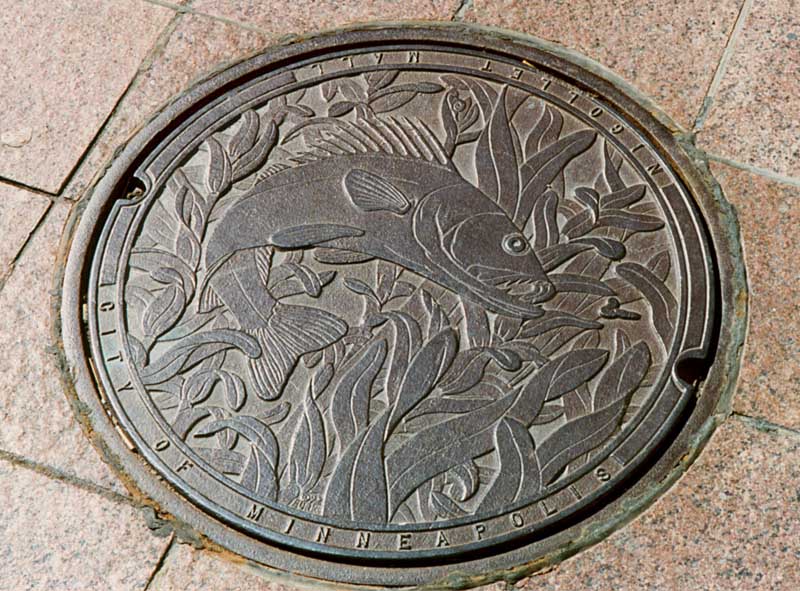
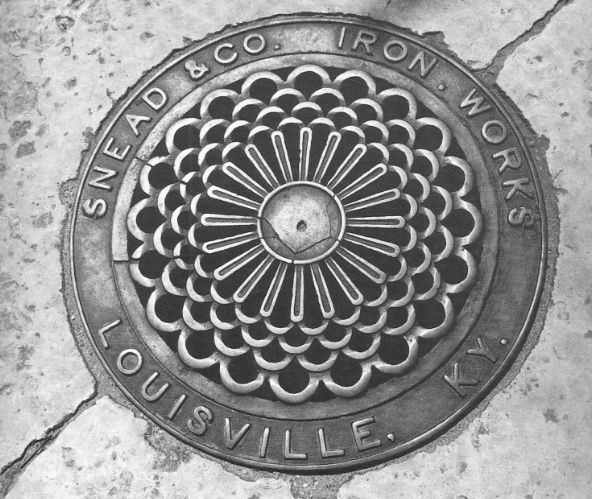
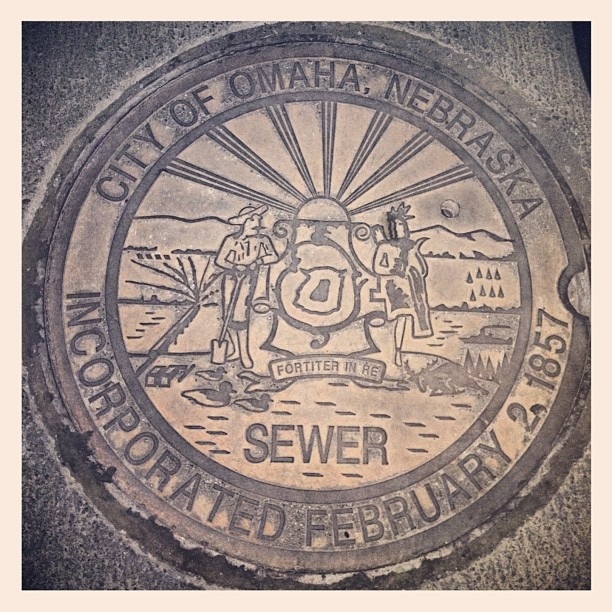
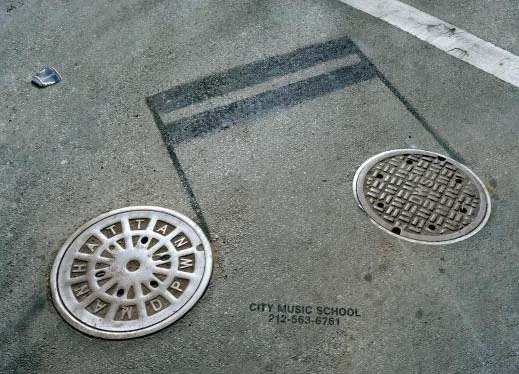
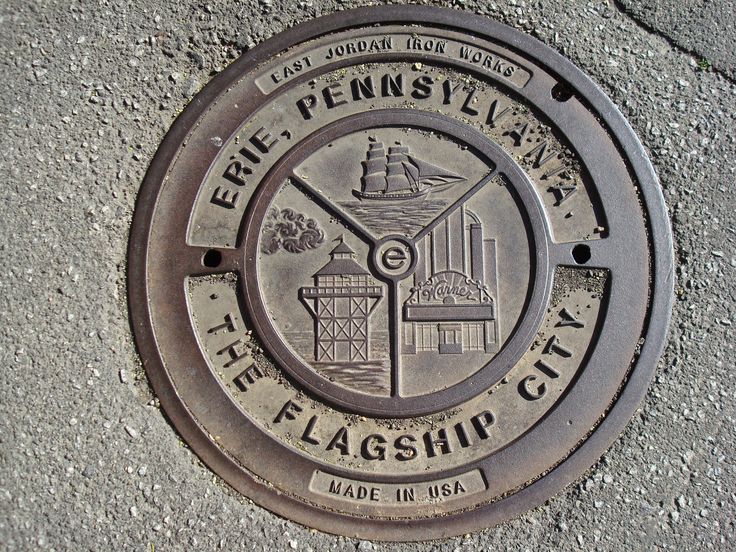
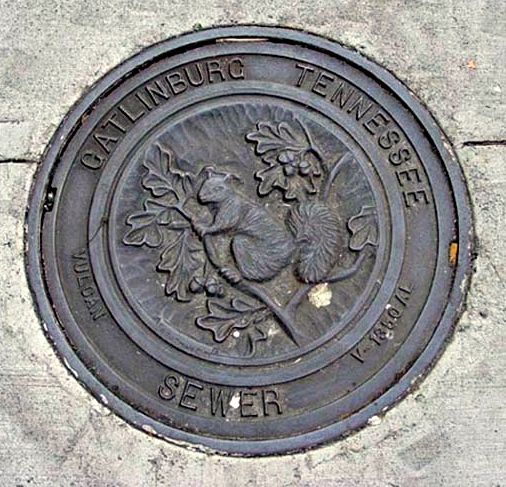
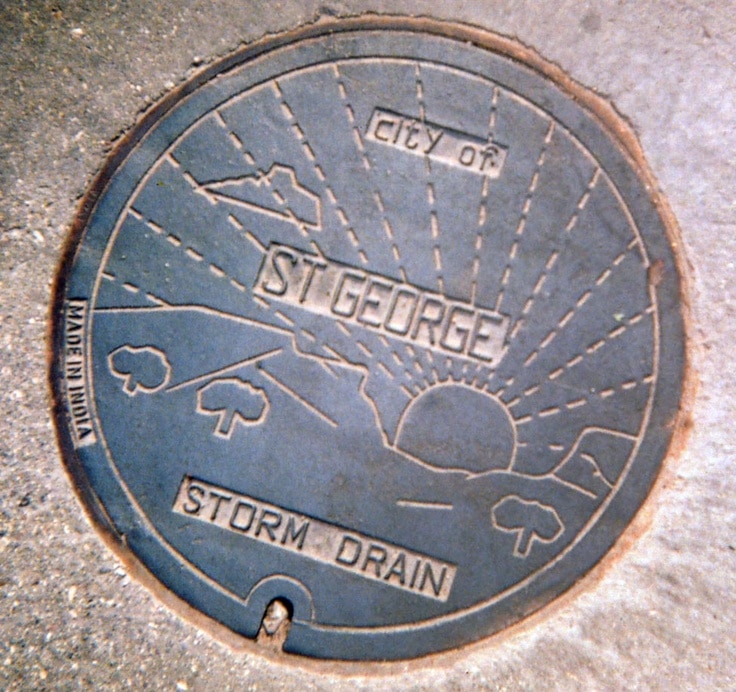
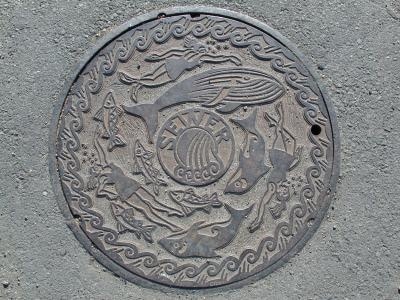
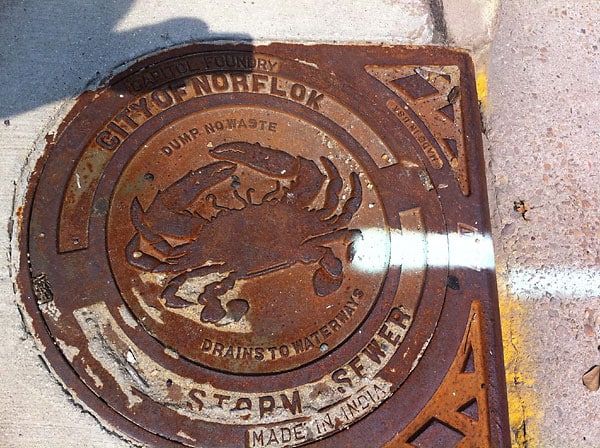
Desert town Peoria, Arizona has a cactus and the sun on its manhole coversThis manhole cover from Phoenix, Arizona sports its namesake, a phoenixMcCloud, California is located in the northern part of the state, nestled at the base of Mt. Shasta, which is featured on its manhole coverThe town seal for Chattanooga, Tennessee, which includes the cannon located on Lookout Mountain overlooking the town, is featured on this manhole coverThe artsy, historic district in the town of Denver, Colorado features a hand-drawn design on its manhole coversMickey Mouse adorns the manhole covers found in Disneyland, CaliforniaThis manhole cover in the City of Jacksonville, Florida, named for Andrew Jackson, features the seventh President of the United States riding his horseThe City of Hollywood, Florida illustrates its tagline, Diamond of the Gold Coast, on this manhole coverThis brightly painted manhole cover featuring a pelican adorns the sidewalk of St. Petersburg, FloridaIn an effort to keep their environment clean, the City of Hutchinson, Kansas chose to emblazon a fish with the message “No Dumping” on its manhole coversStaying true to its roots, New Orleans, Louisiana has a somewhat magical manhole cover Photo courtesy PDPhoto.orgIn 2006, Albuquerque, New Mexico replaced many of their manhole covers with this decorative design in commemoration of their tricentennial celebrationThis plain manhole cover emblazoned with “Boston Sewer” sits amid a cobblestone street in the historic city of Boston, MassachusettsThis artistic manhole cover adorns a street in Detroit, Michigan; photo courtesy of Michele OberholtzerDuluth, Minnesota’s manhole covers on Bob Dylan Way pay tribute to the City’s most famous sonMinneapolis, Minnesota, known as the “City of Lakes” and known for its fishing, has manhole covers adorned with aquatic life and underwater vegetationThis visually pleasing manhole cover in Louisville, Kentucky was adapted for use as cover art for the book “Manhole Covers” by Mimi MelnickThis manhole cover Omaha, Nebraska celebrates some of the City’s historyWhile these manhole covers in front of the Music School in New York City are nondescript on their own, the artwork tying the two together is both creative and playfulThis manhole cover in Erie, Pennsylvania is extremely detailed with historical illustrationsGatlinburg, Tennessee chose to showcase a squirrel on its manhole coversThis manhole cover in St. George, Utah features some rustic artworkSwirling illustrations of waves, marine life, and swimmers adorn this manhole cover found in Seattle, WashingtonIn 2012, this manhole covering Norfolk, Virginia was brought to the attention of local government due to its misspelling of the City’s name; the manhole cover has since been replaced
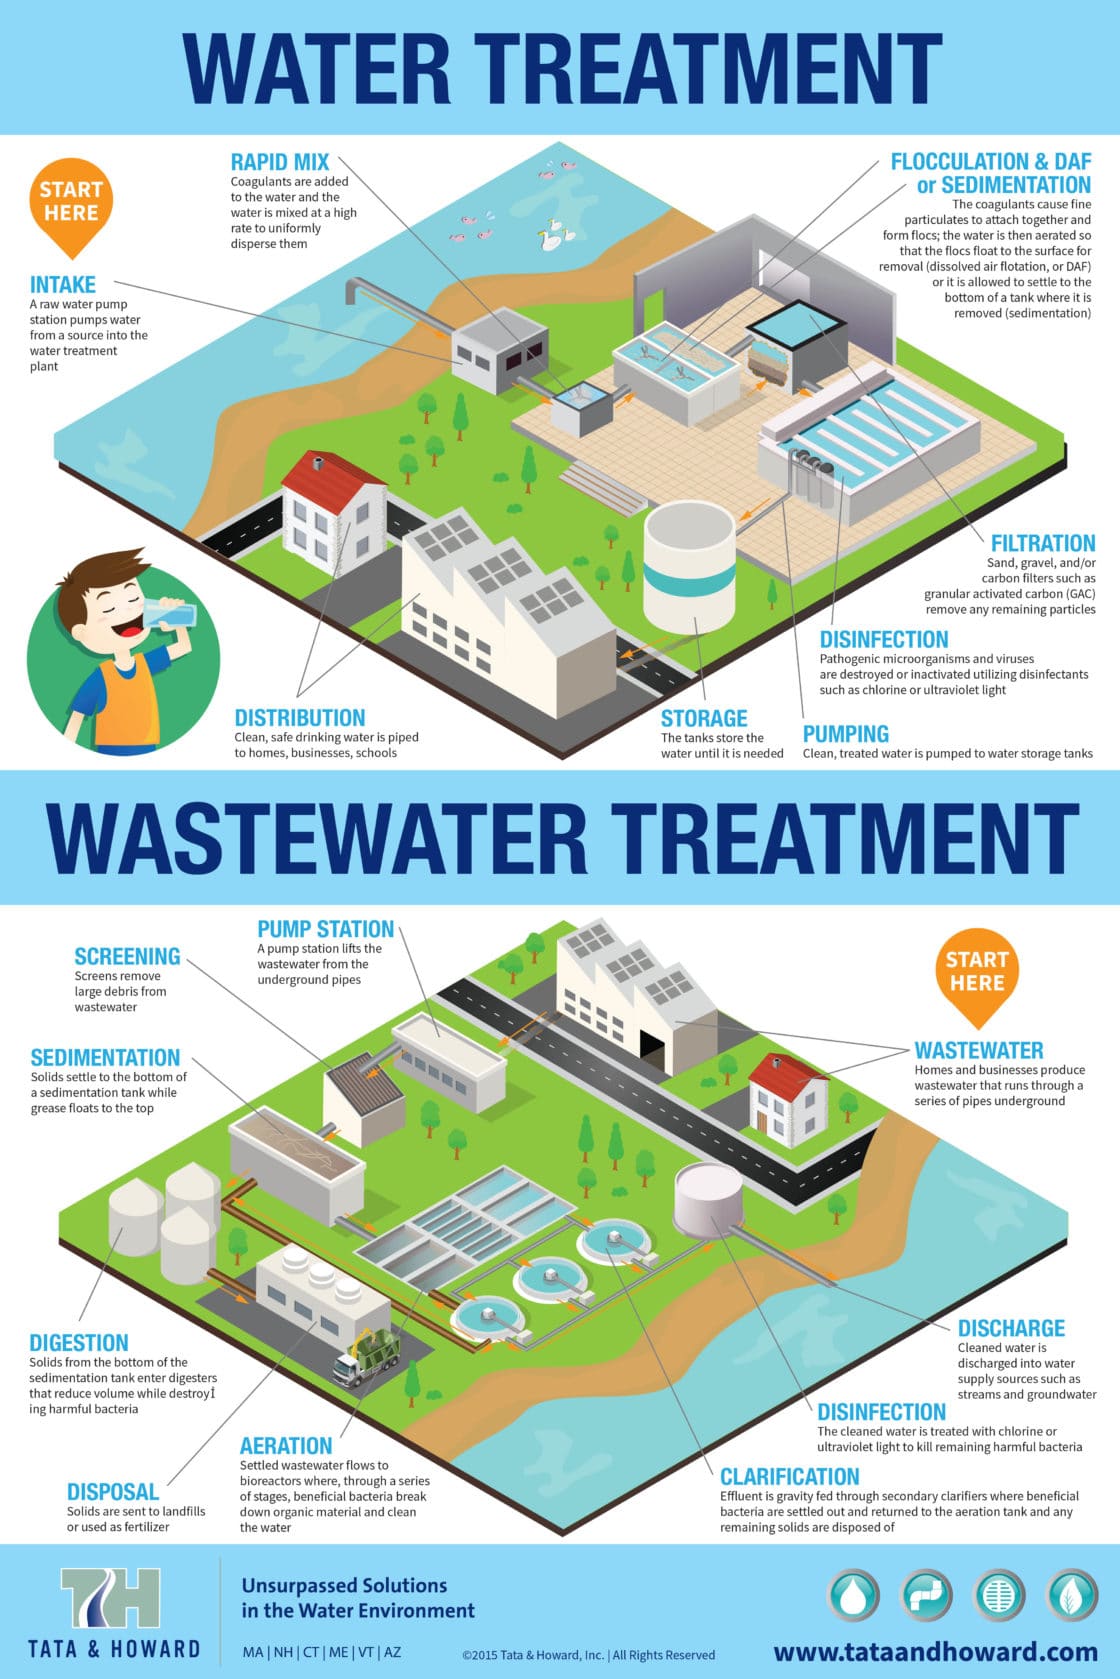
Municipal water and wastewater treatment is a specialized and involved process that focuses on keeping communities healthy and safe. Feel free to download and share, with attribution. For a printable, high resolution version of the water and wastewater treatment infographic, please click here.
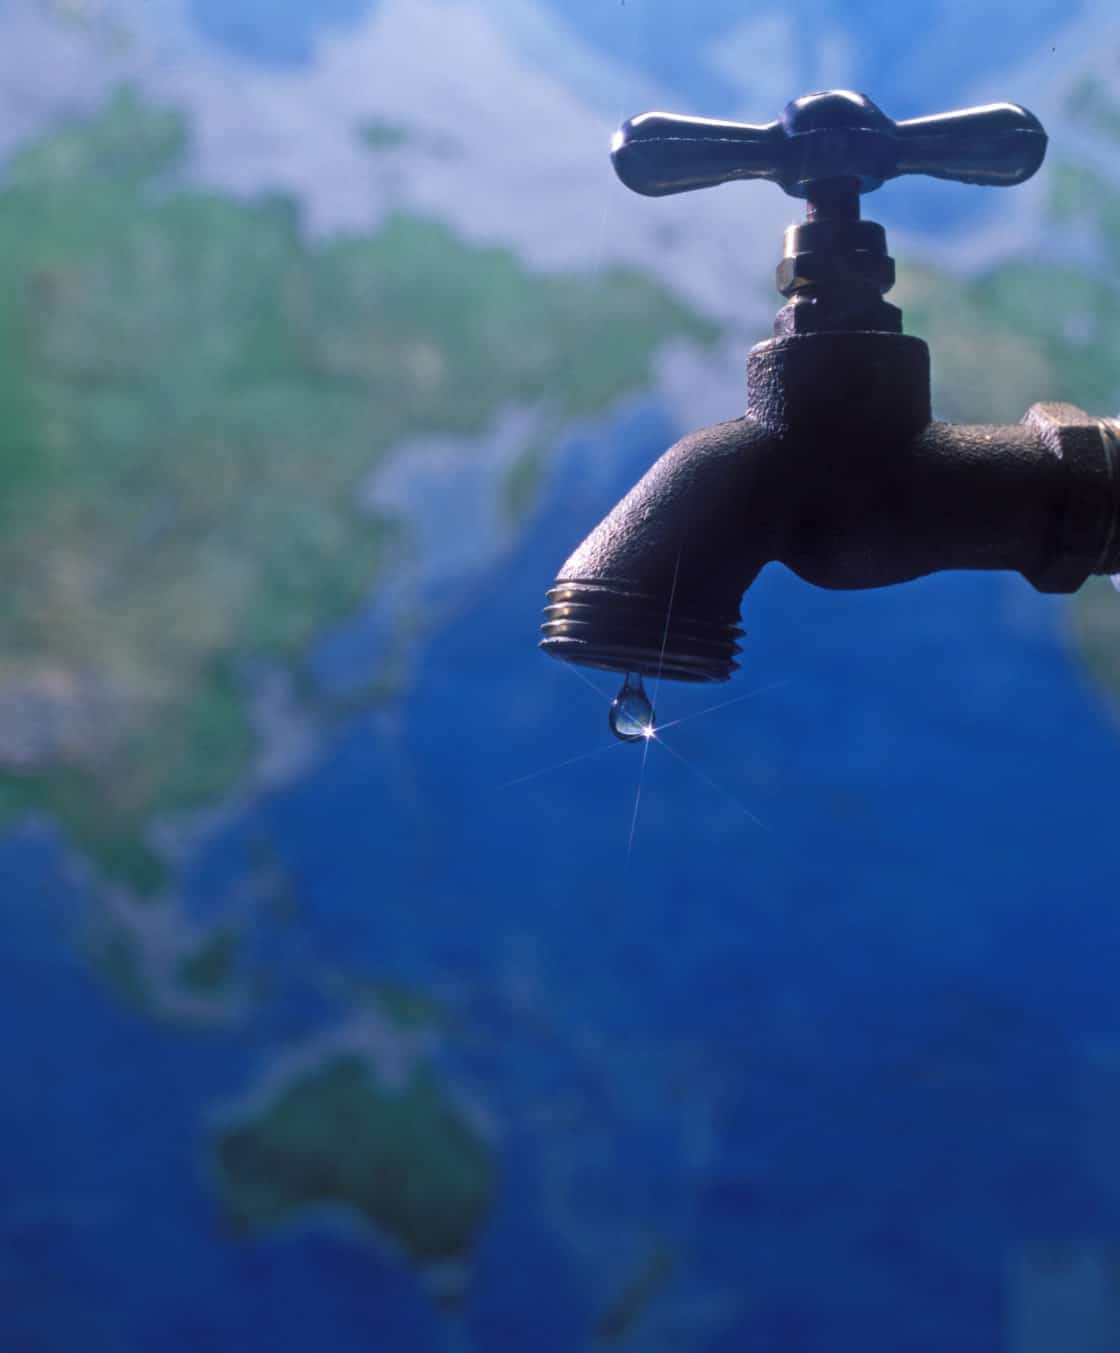
Imagine a day without water. What would you do after you woke up? There would be no shower, no morning cup of coffee, no brushing your teeth, no flushing the toilet. And that’s just first thing in the morning. Imagine the rest of the day without water – it’s almost impossible to do.
Water is life. We’ve heard it before and know it to be true, and yet water is one of the least valued, at least in terms of dollar amounts, resources on the planet. According to the Value of Water Coalition, municipal water in the United States costs the consumer $.01 per gallon, whereas soda costs $2.37 per gallon. In a way, it’s understandable. After all, water isn’t something we think about. If we want fresh, clean water, hot or cold, all we do is turn on the tap. And our wastewater simply flows down the drain or flushes down the toilet. Out of sight, out of mind.
The reality is that providing safe, clean drinking water and treating our wastewater is in fact a complicated and costly endeavor. There are thousands of pipes running beneath our feet, carrying water from treatment plants where all toxins, bacteria, and other harmful material are removed, and there are even more thousands carrying away our wastewater, ensuring that it is hidden away so we aren’t exposed to it or sickened by it. These pipes run to wastewater treatment plants where the wastewater is treated and cleaned before it is returned to the ground to replenish our water supply.
One of the greatest achievements of the 20th century was the construction of our nation’s water and sewer systems. Diseases such as typhoid fever and cholera, once prevalent and deadly, were practically eradicated. Industry thrived, the economy flourished, and public health improved exponentially. Our lives and livelihoods depend on water, yet we balk at investing in it. The average monthly cell phone bill is $73, cable TV bill is $99, and internet bill is $47. Yet the average monthly water bill is only about $30. We can all easily imagine a day without our cell phone, cable TV, or internet; these items are luxuries. And yet we pay more for these services than we do for water. That is a sobering fact that needs to change, and soon.
According to the Value of Water Coalition, the expected longevity of water and wastewater infrastructure is 50 years, yet the average age of these very pipes in Washington D.C. is 79 years. New England infrastructure is even older, much of it over 100 years old. Aging infrastructure accounts for 1.7 trillion gallons of lost water — water that has already been treated and is clean and ready for drinking — per year, which is the amount of water consumed by the top ten American cities annually. With 43% of our nation experiencing drought, and our demand rising due to population growth, this excessive water loss from failing pipes is crippling. The 1.7 trillion gallons of lost water comes at a staggering cost of $2.6 billion, which is about the amount of money that the federal government allots to water infrastructure annually.
To repair our nation’s water and wastewater infrastructure would require an investment of $4.8 trillion over the next 20 years. Yet infrastructure spending is actually down 30% since 2012. Add to that the degradation of our water supply through pollution and environmental damage, and it is clear why communities are struggling to simply meet drinking water standards and to maintain their aging infrastructure, never mind upgrade.
Hoping to share the value of our world’s most precious resource, the Value of Water Coalition conceptualized “Imagine a Day Without Water.” The inaugural event takes place October 6-8, 2015, and encourages everyone, from water suppliers to engineering firms to concerned citizens, to spread the word about the value of water. It’s easy to see that our transportation infrastructure needs investment; after all, hearing about bridge collapses and failing dams is cause for concern, and the American public demands repairs. But what about water? Again, we don’t see it, so we don’t think about it or talk about it. But if our water system failed, life as we know it would halt. Industry depends on water for manufacturing, agriculture requires irrigation, and we need water simply to go on living.
The time to invest in our nation’s water and wastewater infrastructure is now. Help spread the word about the value of water, and encourage friends and colleagues to try to imagine a day without water. With some smart investing, careful planning, education, conservation, and governmental support, the most we will need to do is imagine a day without water, not actually live it.
This week, we celebrate coffee. Tuesday, September 29, is National Coffee Day, a beloved American holiday where coffee powerhouses such as Dunkin’ Donuts, Krispy Kreme, Peet’s, Starbucks, and Wawa offer freebies and discounts. As an added coffee bonus this year, the International Coffee Organisation (ICO) has designated October 1 as the first annual International Coffee Day. This special day will celebrate all things coffee and will be launched in Milan, Italy as part of the city’s 2015 World Fair.
Global Coffee Consumption
After only crude oil, coffee is the most sought commodity in the world, and is worth over $100 billion globally. Sugar, corn, natural gas, and even gold all take a back seat to coffee. The global population drinks over 500 billion cups of coffee every year and more than half of all Americans over the age of 18 drink coffee every single day. Coffee farms, 67% of which are in the Americas and 90% of which are in developing countries, provide the economic livelihood for over 25 million people. And while developing nations grow and produce the world’s coffee, industrialized nations drink it. After water, coffee is actually the most consumed beverage in the world. Finland drinks the most coffee per capita in the world, and America consumes the most coffee overall. Brazil, the top coffee producing nation in the world, ranks a distant 13th per capita consumer.
Environmental Impact
As demand has increased, coffee producing countries have been responsible for a significant amount of global deforestation and watershed damage. Coffee was historically a shade-grown crop, intolerant of direct sunlight. Shade trees provide a habitat for birds that provide natural insect control, and they also enhance soil and encourage water retention in the soil, resulting in shade-grown coffee requiring little to no pesticides or fertilizers.
Unfortunately, only 24% of today’s coffee is actually shade-grown. Newer techniques that call for clear-cutting forests and applying chemicals have been found to greatly increase yields — but at great environmental and health cost. 60% of the six million acres of coffee lands have been completely stripped of shade trees since 1972, and coffee is now the third most pesticide-laden crop in the world, behind only tobacco and cotton. Bird populations have decreased by 20% in the last ten years alone, and soil erosion and depletion resulted in producers searching for new land on which to plant their coffee crops, and further deforestation, particularly of rainforests. Rainforests act as the world’s thermostat by regulating temperatures and weather patterns and are also critical in maintaining Earth’s finite supply of fresh water. Now understood to be unsustainable, this “new” method of growing coffee also damages watersheds and affects the health and livelihood of local populations.
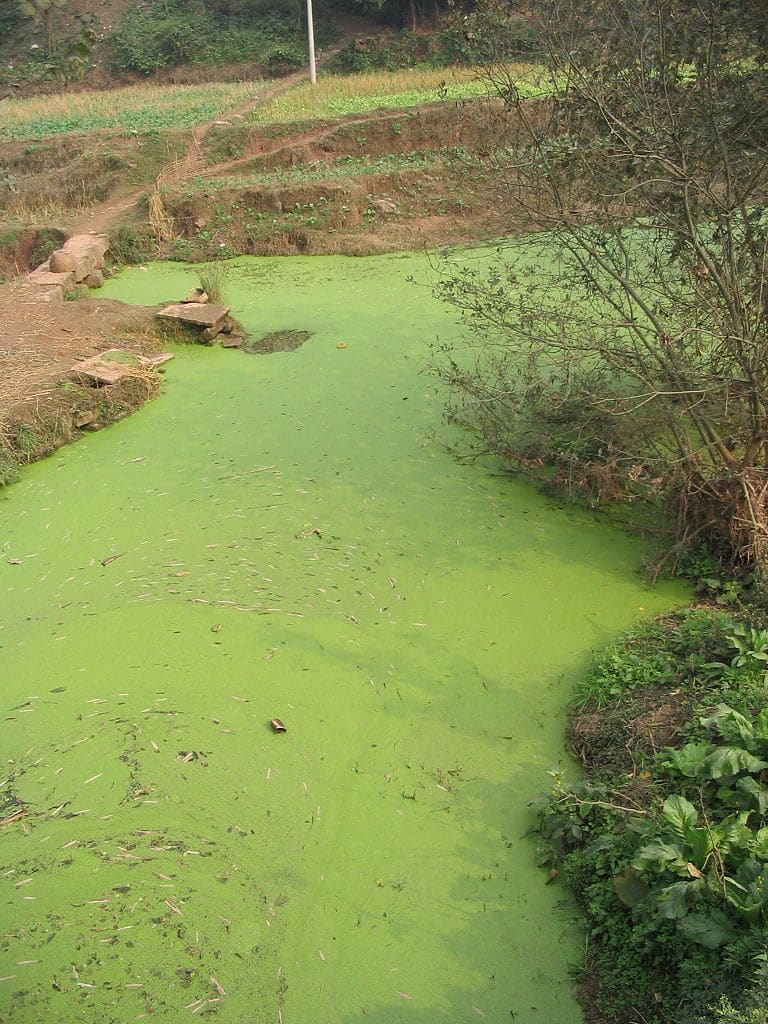
Excessive nitrogen or coffee wastewater from wet mills both contribute to algae blooms in coffee-growing nations
Because the land is clear-cut and coffee is typically grown in highlands, soil erosion and agrochemical runoff are major problems in coffee production. The excessive amount of pesticides and fertilizers needed to grow conventional coffee runs unhindered and unfiltered into lakes and streams downhill from the coffee shrubs. Very often, these lakes and streams are the main water supply for the local community. More and more frequently, water supplies in coffee-growing nations are becoming severely contaminated due to runoff from fertilizer, which adds nitrogen to the depleted soil, and, in turn, the local water. And since nitrogen is a vital nutrient for plants and encourages plant growth, it also encourages the growth of algae in bodies of water. Excessive algae in water bodies, called “blooms”, makes the water unfit for consumption and causes foul odors and tastes. When the algae finally dies and starts to decompose, it removes all oxygen from the water, causing ammonias to form, and results in the widespread die-off of fish and other aquatic organisms. Groundwater beneath coffee farms can also become contaminated with excess nitrogen, causing a health threat to humans.
Pesticide usage in coffee growing also contaminates water supplies. Whether entering the water supply through aerial spraying or from soil erosion and runoff, pesticides are known to be toxic to human and aquatic health. Many of the pesticides used in coffee growing nations have long been banned in the United States, and are known to bio-accumulate, disrupt hormones, and cause cancer.
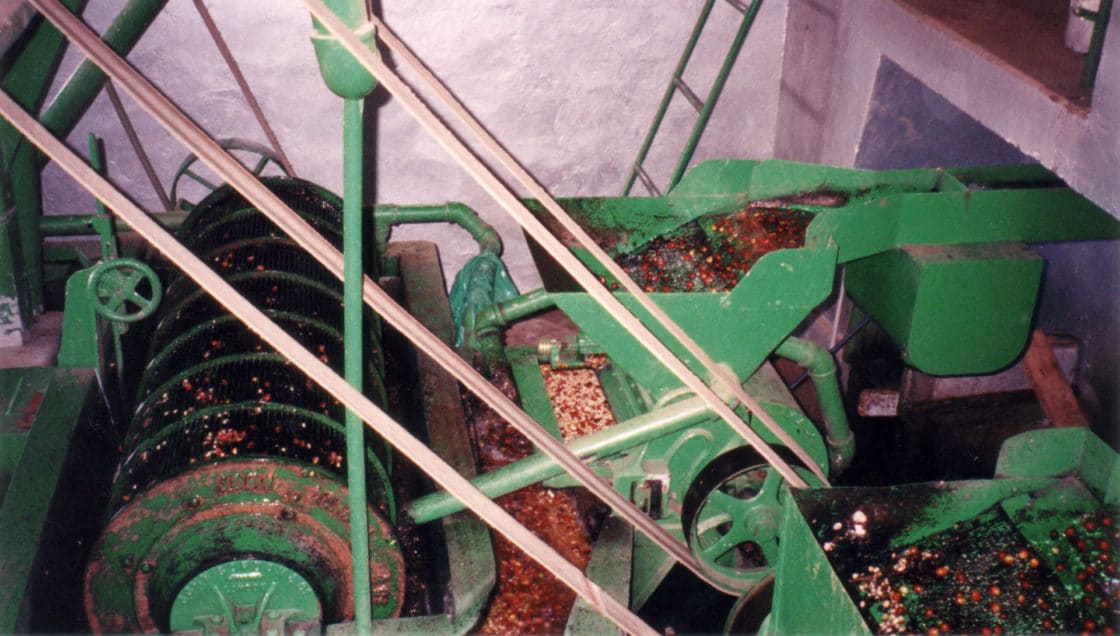
Wet mill coffee processing uses an exorbitant amount of water and produces wastewater that can harm ecosystems in coffee-growing communities
And that’s just the growing. Add coffee harvesting and processing, and the outlook is grim. Conventional coffee is strip harvested, meaning all berries, ripe or not, are stripped off the vine, and sorted and depulped using a wet mill. Water-intensive mills, or wet mills, use water to sort and strip the beans of their mucilage, or protective coating. The beans are then allowed to ferment before they are washed, again utilizing an exorbitant amount of water, to ensure that all of the mucilage has been removed. Even small coffee mills utilize millions of gallons of water over a season, oftentimes depleting local water supplies and causing die-off of aquatic organisms. In addition, the wastewater produced by these wet mills contains nitrates, carbohydrates, proteins, fibers, fat, and many other substances, and these substances end up contaminating the local water supply. In fact, coffee wastewater is one of the largest contributors to water supply contamination in coffee-growing communities. Bacteria that break down the sugars and pectins in coffee wastewater require excessive oxygen, resulting in the same oxygen depletion and subsequent die-off caused by excessive nitrogen as described above. Many times, streams or other bodies of water contaminated in this way are effectively killed, requiring significant treatment that costs more than most of these communities can afford.
Sustainability
A man hand strips coffee in Indonesia
Because of growing knowledge and concern over the detrimental environmental effects of coffee production, solutions have been increasing. Dry mills are one example. Dry mills utilize mechanical demucilagers, do not require fermentation or washing processes at all, and use less than three gallons of water per pound of dry coffee. For wet mills, a solution lies in wetland engineering. For example, TechnoServe and Mother Parkers Tea & Coffee have joined forces to install Vetiver grass wetlands at wet mills. These wetlands, which are a low-cost but sustainable wastewater treatment option, contain deep-rooted Vetiver grass that drinks in wastewater and slows infiltration. Any remaining effluent enters a small pond at the bottom of the wetland where it evaporates.
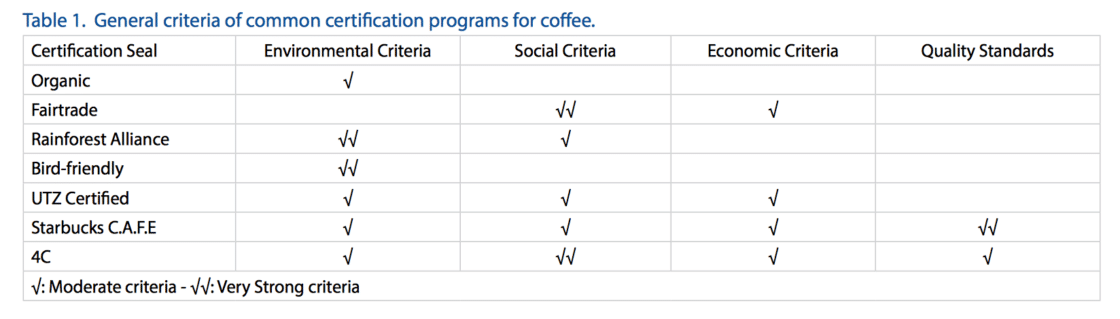
Table courtesy of Department of Wildlife Ecology and Conservation, University of Florida/IFAS Extension,
But there are still plenty of conventional coffee producers, simply because conventional coffee processes are cheaper. Therefore, some forward-thinking companies have taken it upon themselves to require better practices. Mega-coffee chain Starbucks, the third largest restaurant chain in the world, implemented one of the industry’s first sets of sustainability standards, called Coffee and Farmer Equity (C.A.F.E.) Practices. Verified by third-party experts, this set of standards is more stringent than even Organic Certification or Fair Trade Certification, and focuses on both environmentalism as well as social responsibility. Peet’s Coffee & Tea works with certification organizations such as Rainforest Alliance Certification and UTZ Certified — which is on par with Starbucks C.A.F.E. practices — to ensure that every bean they purchase is fair trade as well as sustainably grown. But the San Francisco Bay-based company takes it one step further: they roast all their beans in the nation’s first LEED Gold certified coffee roasting plant, opened in 2007. Other coffee certifications include 4C Certification and Smithsonian Migratory Bird Center’s Bird-Friendly Certification.
Conclusion
Coffee is a beloved beverage, enjoyed worldwide throughout different cultures, but it has come under scrutiny for its negative environmental and humanitarian impact in recent years. There are ways to reduce and even remove the detrimental effects associated with coffee production, and some forward-thinking coffee companies have implemented buying standards in an effort to improve both our environment as well as the livelihood of coffee farmers, while many other small coffee companies sell only fair trade or organic coffees. This week, as we celebrate both National Coffee Day on Tuesday, September 29, and the first annual International Coffee Day on Thursday, October 1, we can choose to support coffee companies who grow responsibly, which means helping to protect our world’s most precious resource — water. Now that’s something to celebrate. Happy Coffee Week!
Pollution Prevention Week 2015, which celebrates the 25th anniversary of the Pollution Prevention (P2) Act, was held September 21-27, 2015. The P2 Act was implemented in 1990 in an effort to address the significant impact that pollution has on our environment. It is inordinately easier to prevent a problem from happening than to fix an already existing problem, and below we’ve compiled a list of some practical steps we can all take to reduce pollution as well as our individual and collective environmental footprints.
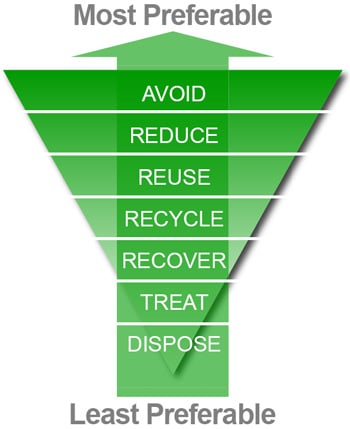
Recycle
The average American generates over four pounds of trash every day and about 1.5 tons of solid waste per year, 75% of which is recyclable. The EPA estimates that we only recycle 30% of it, even though over 87% of Americans have access to a curbside recycling program. In a single year, Americans throw out about 28 billion bottles and jars as well as about 36 billion aluminum cans, the scrap value of which is estimated to be an astonishing $600 million. Glass containers and cans can go from the recycling bin to a store shelf in just 30-60 days, and 20 recycled cans can be made with the energy needed to produce one new can. Recycling takes little effort yet yields significant impact. Here are some ways to recycle:
Participate in an office recycling program for paper, toner cartridges, and kitchen waste
Recycle all plastics, glass, metals, and paper with a single stream recycling program
Recycle used motor oil, eyeglasses, cell phones, electronics, mattresses, and other household waste at appropriate disposal sites
Donate used clothing, furniture, household items, and books to charitable organizations
Start a compost pile for kitchen waste, or better yet…
Reduce greenhouse gas emissions by cutting food waste
Environmental activist Rob Greenfield displays one of his “Food Waste Fiascos”, or the edible food he found in dumpsters in one city
In the United States, food waste is the largest single source of waste, with 30-40% of the food supply wasted, equaling more than 20 pounds of food per person per month. According to a Food and Agriculture Organization of the United Nations (FAO) report, about a third of the food produced for human consumption worldwide — about 1.3 billion metric tons — is wasted, accounting for the equivalent of about 3.3 billion metric tons of greenhouse gas emissions. To put it into perspective, that’s about twice the amount of carbon emitted from America’s transportation sector and close to twice the annual emissions of the entire country of India. And all that wasted food equates to a lot of wasted water, as raising and growing food requires an exorbitant amount of water. To produce one pound of beef takes about 1,800 gallons of water, and to produce a pound of rice takes about 400 gallons. In fact, the amount of food we waste also wastes about 250 cubic kilometers worth of ground and surface water — an amount about three and a half times the volume of Lake Mead when full.
Reducing the amount of food we throw away starts at the individual level. Plan meals for the week and make a shopping list — and stick to it. Be sure to eat any leftovers for lunch the next day, which will also save money (and calories!) when compared with eating out. Donate any unused food to food banks and shelters. Request “doggie bags” from restaurants, freeze fresh foods before they spoil, and use aging fruits in smoothies and baking. These are all simple yet effective ways to greatly reduce the amount of food we waste.
Reduce usage and carbon footprint
In one year, Americans fill landfills with trash equivalent to the weight of 88 million cars and produce enough trash to circle the earth 24 times. We have the highest per capita water usage in the world, and we use 26% of the world’s energy. In addition, we produce a significant amount of hazardous waste, which is any liquid, solid, or gas that may cause significant threats to human health or the environment if improperly managed. Sources of hazardous waste include industry, research, medical, household, chemical producers, agriculture, and mining, as well as many others. Hazardous waste is often disposed of in landfills or injection wells, where the toxic substances can leak into surrounding groundwater. Groundwater is a major source of drinking water and, once it is contaminated, it is extremely difficult, costly, and sometimes even impossible to remove pollutants. Recycling and waste minimization is the best — and easiest — way to deal with hazardous waste. Changing our daily habits is a simple way to reduce our usage and environmental impact, and to lessen the amount of pollution we produce.
Use reusable grocery and shopping bags
Install programmable thermostats to automatically turn down the heat or air conditioning at night
Replace incandescent lights with fluorescents or LEDs
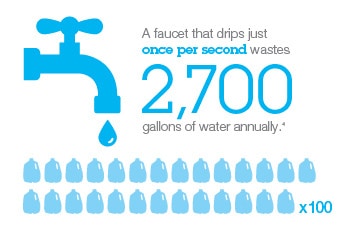
Install water-efficient toilets, faucets, and shower heads
Fix all household leaks
Plant drought-resistant grass and plants to reduce water needs
Only run washing machines and dishwashers when they are full
Power down and unplug electronics when not in use
Print double-sided on recycled paper, and implement a “think before you print” mindset
Dispose of all household hazardous waste including batteries, cleaning fluids, paint thinners, pesticides, and mercury items at a dedicated collection site
Purchase non-toxic products with minimal packaging
Use little to no fertilizer or pesticides, especially near rivers, streams, lakes, and ponds
Buy locally, including from farmers, businesses, and manufacturers, as it reduces fuel needs and transportation emissions and supports the local economy
Carpool, bike, walk, or take public transportation to work when possible
Protect our water supply — careful what you flush!
Speaking of water contamination, there is another source of potential water pollutant that is in every American’s home: the toilet. It seems like the perfect place to dispose of all things unsightly. Unfortunately, after the whoosh and the swirl, the item doesn’t simply disappear. In fact, it travels a complex path. What we flush down our toilets travels through sewer pipes to wastewater treatment plants, where it is treated and piped back into our lakes and streams. Therefore, we need to be mindful of protecting not only our pipes and sewer systems, but also our environment. Private septic systems are also at risk for clogging, failing, and for leaching toxins back into the water supply. The only items that should ever be flushed down a toilet are human excretions and plain old toilet paper. To show some concrete reasons why the toilet shouldn’t be considered a garbage disposal, we’ve made a list of commonly flushed items that wreak havoc on wastewater systems and our ecosystem.
Disposable Diapers
Not only do they cause instant clogging, but they also are loaded with toxic coagulating chemicals that simply shouldn’t be in our water supply.
Feminine Products
Feminine products are akin to diapers and contain chemicals as well as non-biodegradable parts, and they are responsible for the majority of household clogs. All of these items should go in the trash – including the applicators.
Band-Aids
They are non-biodegradable and a biohazard and should be thrown in the trash.
Automotive Fluids, Paint, Solvents, Sealants, and Thinners
All of these items contain toxic chemicals that contaminate water. Please dispose of them in an appropriate manner, not down the toilet.
Unused Medications
While flushing seems like a great idea for unused meds – after all, we don’t want them getting into the wrong hands – it is actually extremely dangerous. Flushed meds negatively impact ecosystems by seriously disrupting reproductive cycles of fish, and flushed antibiotics encourage the evolution of drug-resistant microbes. Water treatment facilities do not filter meds, and they are entering our water supply at an alarming rate. Medications should be disposed of safely in the garbage or through an approved take-back site. Please check www.takebackyourmeds.org for more info.
Cigarette Butts
Cigarettes are loaded with toxic chemicals that end up in our water supply when the butts are flushed. Don’t flush, or better yet, don’t smoke!
Cat litter
Most cat litter is made from clay and sand, which should absolutely never be flushed down any toilet, and cat feces contains toxins and parasites that shouldn’t be in our water supply.
Pets
Give the goldfish, mouse, or gerbil a good old-fashioned burial. Decomposing animals cause blockages and release toxins into our water supply.
Other items of note: wipes (even if they say flushable!), cooking fats, paper towels, cotton balls, hair, cosmetics, cleaning supplies, food, and chewing gum. When in doubt, throw it out!
There are myriad ways to improve our environment by reducing the pollution we produce, and the above ideas are a small sampling of how we can be greener in our daily lives. P2 Week is the ideal time to take a look at our daily habits and patterns and to see what steps we can take to lessen our environmental impact. If every person made even a small effort to be more eco-conscious, the total impact would be staggering. Whether it is protecting our water supply, reducing greenhouse gas emissions, or using fewer toxic products, let’s all implement a few small changes this week to protect our environment and reduce pollution. Happy P2 Week!
Let's stay in touch.
Get the latest news, blogs, and insights conveniently in your inbox.
 A toilet is a necessary item we all use multiple times a day, and something we typically choose not to discuss. After all, who wants to talk about toilets — and why we need them. But that’s just what World Toilet Day aims to change.
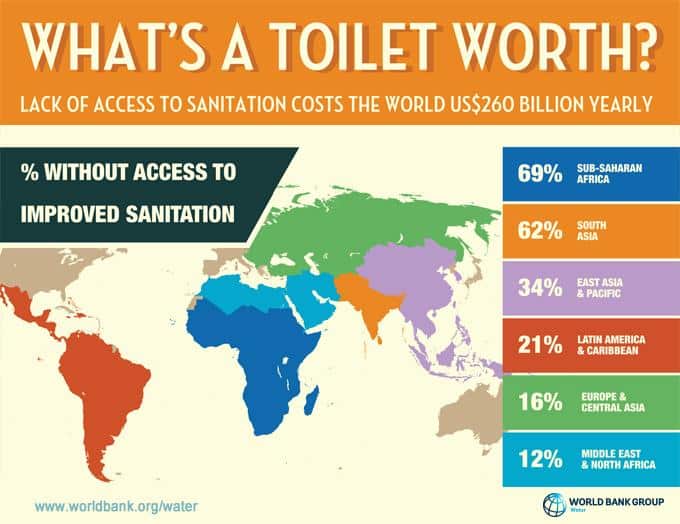 On November 19, 2001, former construction industry executive Jack Sims founded the World Toilet Organization, and the inaugural World Toilet Summit was held in Singapore. Every year since then, we have celebrated World Toilet Day in an effort to bring awareness of the global santitation crisis, and to eliminate the taboo surrounding the subject of toilets and sanitation. Since its inception, World Toilet Day has gained the notice and support of many organizations in the private sector, civil society, and the international community, and was officially recognized by the United Nations in 2013.
 1 in 3 people — 2.5 billion of the world’s total population — lacks access to a clean and safe toilet