Meeting Wastewater Utilities’ Needs Through Capital Efficiency

restrooms-300x200Wastewater. It’s something that will always exist, and will always require collection and treatment. Just like improved water, improved sanitation is one of the key contributing factors to a developed nation, significantly improving public health, educational opportunity, and workforce viability. And while the United States boasts nearly 100% improved water and sanitation, there is still cause for concern.

In the American Society of Civil Engineers (ASCE) 2013 Report Card, wastewater received a “D” grade. Why? Because our existing infrastructure is in desperate need of repair and replacement, and a significant funding gap exists. This gap can be attributed to the fact that funding has been declining while regulations continue to increase.

Pic1-TotalPublicSpending-300x200In March of 2015, the Congressional Budget Office (CBO) published a report on annual government expenditures on infrastructure, titled Public Spending on Transportation and Water Infrastructure, 1956 to 2014. The data, collected from the Office of Management and Budget (OMB) for federal expenditures and from the Census Bureau for state and local government expenditures, indicates that federal, state, and local governments in the United States have been investing LESS in water and wastewater infrastructure than ever before. From 1956 to the late 1980s, total government spending increased in real dollars by approximately 3%-4% per year, and then from 1%-2% through 2009. These expenditures include both capital and operations and maintenance (O&M) costs. However, from 2010 until present, total government spending has actually decreased by 8%.

Pic3-OMvsCapital-300x200To further complicate matters, capital expenditure has decreased at a faster rate than O&M expenditure. From 1956 to 1980, public spending was basically split between capital expenditures — to build or replace water and wastewater systems —  and O&M of the systems. However, since 1980, O&M spending continued to grow at an annual rate of 4%-6% to the 1990s, and then at an annual rate of 1%-3% through 2009, since when it has remained flat. In contrast, capital spending grew at an annual rate of only about 1%-2% since 1980, and has declined at an average annual rate of 4% since 2009. Governments now spend twice as much on O&M of their existing systems than on capital expenditures to repair, rehabilitate, or replace existing assets or for the installation of new infrastructure. In addition, state and local government is now saddled with nearly the full burden of capital expenditure, as federal spending has been steadily on the decline since 1976.

Clearly, municipalities are faced with the almost insurmountable task of staying up to date with all current regulations while also improving outdated and failing systems. Because wastewater collection and treatment is such a crucial aspect of modern day society, it has become paramount that municipalities find cost-effective and efficient ways of maintaining and updating critical infrastructure.

Dollar sign sink in clear blue water

One of the most effective ways in which municipalities can intelligently allocate their limited infrastructure dollars is by implementing a clear and systematic plan of action for capital improvement projects. Typically, asset management is considered to be the standard by which wastewater utilities address capital assets. Defined by the EPA as managing infrastructure capital assets to minimize the total cost of owning and operating them, while delivering the service levels customers desire, asset management certainly plays a key role in smart capital planning. However, asset management should only be part of the equation. Hydraulic modeling and system criticality are two equally important aspects which should be examined when planning long-term capital expenditure.

Tata & Howard’s Wastewater Capital Efficiency Plans™ identify those areas of your wastewater systems needing rehabilitation, repair, or replacement that make the most efficient use of your limited infrastructure dollars by combining the concepts of hydraulic modeling, system criticality, and asset management into a single comprehensive report. Each report is tailored to the individual utility distribution system and provides utilities with a database and Geographic Information System (GIS) representation for each pipe segment within their underground piping system. The CEP report then prioritizes system piping improvements and provides estimated costs for replacement and rehabilitation.

Our three circle approach includes the following:

Three Circles WASTEWATER 515-finalHydraulic modeling

  • Model verification if available
  • Compare flows with design carrying capacity
  • Hydraulic deficiencies
  • History of SSOs
  • High infiltration/inflow rates

Critical Components

  • Interceptors
  • Trunk sewers and force mains
  • Residential sewer mains

Asset Management

  • Establish score for each pipe segment based on blockages/collapses, I/I rates, installation year, soil corrosivity, PACP structural and maintenance ratings, and other criteria.

A comprehensive CEP provides a utility with not only a prioritized list of logically thought out infrastructure projects, but also a justifiable and defendable plan of action to present to town administrators when planning budgets.

Manhole_cover_sewer_closeup-300x200To continue as a leading industrialized nation, our wastewater utilities must not only remain safe and functional, but also progressive and up to date with current and future regulations. Because funding is declining while costs and population are increasing, it is more important than ever for wastewater utilities to methodically prioritize and plan all repairs and improvements. Only through the implementation of a well-researched and systematic course of action will utilities be prepared to provide safe and dependable wastewater services both now and in the future.

Funding Assistance to Meet Water and Wastewater Infrastructure Needs


Water and Wastewater Infrastructure

Water and Wastewater Infrastructure Infographic courtesy of WaterIsLife.net

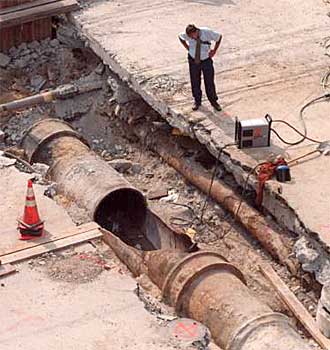
The vast and intricate network of pipes buried beneath our feet is one of the key contributors to the economic success of our nation. Unfortunately, much of our water infrastructure was installed prior to WWII, with some east coast pipes dating back to the late 1800s. Also, many of our nation’s wastewater treatment plants were built in response to the passage of the 1974 Clean Water Act and are now 30-40 years old. Therefore, much of our nation’s water and wastewater infrastructure has reached the end of its useful life and requires repair or replacement.

The ASCE gave both Drinking Water and Wastewater a “D” grade in its 2013 Report Card for America’s Infrastructure; and because water has been so historically undervalued in America, municipalities simply do not have the funds to make the required improvements. In fact, a 2002 US EPA study titled Clean Water and Drinking Gap Analysis Report compared America’s drinking water and wastewater infrastructure needs to the available revenues of utilities. Without including exacerbating factors such as population growth or climate change, the report showed a projected gap in funding over the next 20 years of over $500 billion.

Certainly, our nation must find a way to bridge the funding gap, which will require rate increases and, therefore, community education on conservation practices as well as the value of water. And while these rate increases will provide a portion of the necessary funding, utilities and consumers alone cannot carry the full burden of the funding gap. Thankfully, there are myriad funding opportunities available to assist communities with critical water and wastewater improvements, some of which are listed below:

USDA Rural Development Water & Waste Disposal Loan & Grant Program

Burst water main
Burst water main

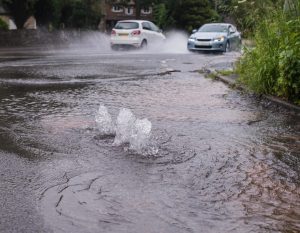
The USDA Rural Development (RD) Water & Waste Disposal Loan & Grant Program provides funding for clean and reliable drinking water systems, sanitary sewage disposal, sanitary solid waste disposal, and stormwater drainage to households and businesses in eligible rural areas. This program assists qualified applicants that are not otherwise able to obtain commercial credit on reasonable terms. Areas that may be served include rural areas and towns with fewer than 10,000 people, tribal lands in rural areas, and colonias.

USDA RD funding provides long-term, low-interest loans which may be combined with grants if necessary to keep user costs reasonable. Funds may be used to finance the acquisition, construction, or improvement of drinking water sourcing, treatment, storage and distribution; sewer collection, transmission, treatment, and disposal; solid waste collection, disposal and closure; and stormwater collection, transmission, and disposal.

Clean Water State Revolving Fund (CWSRF) Program

stormwater drainEstablished by the 1987 amendments to the Clean Water Act, the CWSRF Program is a federal-state partnership that provides a permanent, independent source of low-cost financing to communities for a wide range of water quality infrastructure projects. The program is a powerful partnership between EPA and the states that gives states the flexibility to fund a range of projects that address their highest priority water quality needs.

Using a combination of federal and state funds, state CWSRF programs provide loans to eligible recipients for many types of water infrastructure projects, including construction of publicly owned treatment works; nonpoint source; national estuary program projects; decentralized wastewater treatment systems; stormwater; water conservation, efficiency, and reuse; watershed pilot projects; energy efficiency; water reuse; security measures at publicly owned treatment works; and technical assistance.

Drinking Water State Revolving Fund (DWSRF) Program

Water storage tank in Somersworth, NH

The DWSRF Program is a federal-state partnership to help ensure safe drinking water. Created by the 1996 Amendments to the Safe Drinking Water Act (SDWA), the DWSRF is a financial assistance program to help water systems and states achieve the health protection objectives of the SDWA. The program is a powerful partnership between EPA and the states. Building on a federal investment of over $17.3 billion, the state DWSRFs have provided more than $27.9 billion to water systems through 2014. This assistance was provided through over 11,400 assistance agreements for improving drinking water treatment; fixing leaky or old pipes (water distribution); improving source of water supply; replacing or constructing finished water storage tanks; and other infrastructure projects needed to protect public health.

The DWSRF Program funds a wide range of drinking water infrastructure projects, including treatment projects to install or upgrade facilities to improve drinking water quality to comply with SDWA regulations; transmission and distribution rehabilitation, replacement, or installation to improve water pressure to safe levels or to prevent contamination caused by leaky or broken pipes; rehabilitation of wells or development of eligible sources to replace contaminated sources; installation or upgrade of finished water storage tanks to prevent microbiological contamination from entering the distribution system; interconnecting two or more water systems; constructing a new system to serve homes with contaminated individual wells; and consolidating existing systems into a new regional water system.

Water Infrastructure Finance and Innovation Act (WIFIA)

Business concepts - ship from dollar money on water

Enacted in 2014 as part of the Water Resources and Reform Development Act, WIFIA establishes a financing mechanism for water and wastewater infrastructure projects to be managed by EPA Headquarters. The WIFIA program provides low interest rate financing for the construction of water and wastewater infrastructure. Funded projects must be nationally or regionally significant, and individual projects must be anticipated to cost no less than $20 million.

WIFIA works separately from, but in coordination with, the State Revolving Fund (SRF) programs to provide subsidized financing for large dollar-value projects. Eligible projects include CWSRF eligible projects; DWSRF eligible projects; projects for enhanced energy efficiency at drinking water and wastewater facilities; acquisition of property if it is integral to the project or will mitigate the environmental impact of a project; bundled SRF projects submitted under one application by an SRF program; and combinations of projects secured by a common security pledge.

Northern Border Regional Commission (NBRC)

Troy-Jay, VT received $250,000 from NBRC for upgrades to the community's wastewater treatment plant pump station
Troy-Jay, VT received $250,000 from NBRC for upgrades to the community’s wastewater treatment plant pump station

The NBRC was formed by Congress in 2008 in order to help fund economic and community development projects in Maine, New Hampshire, Vermont, and New York. NBRC was formed to help alleviate distress in the hard-hit northern counties of each state.  Bordering Canada, these counties generally have higher levels of unemployment,  population loss, and lower incomes.

Eligible projects include those that develop the transportation, telecommunication, and basic public infrastructure within the region; assist the region in obtaining job skills and employment related education, as well as entrepreneurship, technology, and business development; provide basic health care and other public services for those areas that are severely economically distressed and underdeveloped; encourage resource conservation, tourism, recreation, and preservation of open spaces in a manner consistent with economic development goals; or support the development of renewable and alternative energy sources.

Other Funding Sources

Wastewater treatment plant in Flagstaff, AZ

In addition to those listed above, there are many other funding sources. Some of these include SWMI GrantsWater Infrastructure Assessment and Planning Grants, Community Block Development Grants (CBDG), and Watersheds & Water Quality in Massachusetts; Water Infrastructure Finance Authority of Arizona (WIFA) and Water and Wastewater Energy Efficiency Rebates through Arizona Public Service (APS) in Arizona; State Aid Grant Program (SAG) in New Hampshire; and Texas Water Development Fund (TWDF)Economically Distressed Areas Program (EDAP)Rural Water Assistance Fund (RWAF), and the State Participation Program (SPP) in Texas.

In Conclusion

Investing in water and wastewater infrastructure now is critical to the sustainability of our economy and the health of our nation. By implementing necessary rate increases and conservation techniques along with community education and robust funding assistance, our nation will have the ability to successfully to bridge the infrastructure funding gap and ensure the economic and environmental viability of our nation for both present and future generations.

25 Unique Manhole Covers in the U.S.

Manhole covers can be found in cities throughout the world, and are typically not given a second thought. After all, these unobtrusive, circular covers lead to underground infrastructure, which to most people is out of sight, out of mind. But manhole covers can actually be attractive and interesting, and are sometimes custom-designed and even whimsical. They also have an extensive history.

Beginning around 3500 BCE, stone slabs or wood pieces were first used to provide access to covered trenches that carried sewage away from cities, and this basic design was utilized until around 1850 CE, when the modern manhole was developed to provide access to then-emerging water and wastewater infrastructure. Since that time, manhole covers, which are typically round and weigh up to 300 lbs. each, have been manufactured from cast iron and haven’t changed much.

While many manhole covers are basic, with either no verbiage or a one word, generic label such as “sewer,” there are some unsung treasures throughout the country that are quite eye-catching. Below, we have listed 25 unique manhole covers from all areas of the country, and we encourage you to also go “drainspotting” the next time you find yourself walking city streets. You may be surprised at what you find, so be sure to let us know in the comments if you find any unusual or interesting covers. Enjoy!

Arizona_Brisbee_manhole_cover
This manhole cover from gold mining town Bisbee, Arizona features a mining cart filled with gold nuggets


Arizona_manhole_cover
Desert town Peoria, Arizona has a cactus and the sun on its manhole covers
Arizona_Phoenix_manhole_cover
This manhole cover from Phoenix, Arizona sports its namesake, a phoenix
California_McCloud_manhole_cover
McCloud, California is located in the northern part of the state, nestled at the base of Mt. Shasta, which is featured on its manhole cover
Chattanooga_manhole_cover
The town seal for Chattanooga, Tennessee, which includes the cannon located on Lookout Mountain overlooking the town, is featured on this manhole cover
Colorado_Denver_manhole_cover
The artsy, historic district in the town of Denver, Colorado features a hand-drawn design on its manhole covers
Disneyland_manhole_cover
Mickey Mouse adorns the manhole covers found in Disneyland, California
Florida_Jacksonville_manhole_cover
This manhole cover in the City of Jacksonville, Florida, named for Andrew Jackson, features the seventh President of the United States riding his horse
Florida_manhole_cover
The City of Hollywood, Florida illustrates its tagline, Diamond of the Gold Coast, on this manhole cover
florida_pelican_manhole_cover
This brightly painted manhole cover featuring a pelican adorns the sidewalk of St. Petersburg, Florida
Kansas_manhole_cover
In an effort to keep their environment clean, the City of Hutchinson, Kansas chose to emblazon a fish with the message “No Dumping” on its manhole covers
Staying true to its roots, New Orleans, Louisiana has a somewhat magical manhole cover Photo courtesy PDPhoto.org
Staying true to its roots, New Orleans, Louisiana has a somewhat magical manhole cover
Photo courtesy PDPhoto.org
new_mexico_manhole_cover
In 2006, Albuquerque, New Mexico replaced many of their manhole covers with this decorative design in commemoration of their tricentennial celebration
Massachusetts_Boston_manhole_cover
This plain manhole cover emblazoned with “Boston Sewer” sits amid a cobblestone street in the historic city of Boston, Massachusetts
Michigan_manhole_cover
This artistic manhole cover adorns a street in Detroit, Michigan; photo courtesy of Michele Oberholtzer
Minnesota_Duluth_Bod_Dylan_manhole_cover
Duluth, Minnesota’s manhole covers on Bob Dylan Way pay tribute to the City’s most famous son
Minnesota_Minneapolis_manhole_cover
Minneapolis, Minnesota, known as the “City of Lakes” and known for its fishing, has manhole covers adorned with aquatic life and underwater vegetation
Louisville Kentucky manhole cover
This visually pleasing manhole cover in Louisville, Kentucky was adapted for use as cover art for the book “Manhole Covers” by Mimi Melnick
nebraska_manhole_cover
This manhole cover Omaha, Nebraska celebrates some of the City’s history
While these manhole covers in front of the Music School in New York City are nondescript on their own, the artwork tying the two together is both creative and playful
Pennsylvania_manhole_cover
This manhole cover in Erie, Pennsylvania is extremely detailed with historical illustrations
Tennessee_manhole_cover
Gatlinburg, Tennessee chose to showcase a squirrel on its manhole covers
Utah_StGeorge_manhole_cover
This manhole cover in St. George, Utah features some rustic artwork
Washington_Seattle_gasworks_park_manhole_cover
Swirling illustrations of waves, marine life, and swimmers adorn this manhole cover found in Seattle, Washington
Virginia_Norfolk_manhole_cover_misspelled
In 2012, this manhole covering Norfolk, Virginia was brought to the attention of local government due to its misspelling of the City’s name; the manhole cover has since been replaced


Imagine a Day Without Water

imagine_a_day_without_waterImagine a day without water. What would you do after you woke up? There would be no shower, no morning cup of coffee, no brushing your teeth, no flushing the toilet. And that’s just first thing in the morning. Imagine the rest of the day without water – it’s almost impossible to do.

cost_of_water_vs_sodaWater is life. We’ve heard it before and know it to be true, and yet water is one of the least valued, at least in terms of dollar amounts, resources on the planet. According to the Value of Water Coalition, municipal water in the United States costs the consumer $.01 per gallon, whereas soda costs $2.37 per gallon. In a way, it’s understandable. After all, water isn’t something we think about. If we want fresh, clean water, hot or cold, all we do is turn on the tap. And our wastewater simply flows down the drain or flushes down the toilet. Out of sight, out of mind.

The reality is that providing safe, clean drinking water and treating our wastewater is in fact a complicated and costly endeavor. There are thousands of pipes running beneath our feet, carrying water from treatment plants where all toxins, bacteria, and other harmful material are removed, and there are even more thousands carrying away our wastewater, ensuring that it is hidden away so we aren’t exposed to it or sickened by it. These pipes run to wastewater treatment plants where the wastewater is treated and cleaned before it is returned to the ground to replenish our water supply.

water_loss_year_united_statesOne of the greatest achievements of the 20th century was the construction of our nation’s water and sewer systems. Diseases such as typhoid fever and cholera, once prevalent and deadly, were practically eradicated. Industry thrived, the economy flourished, and public health improved exponentially. Our lives and livelihoods depend on water, yet we balk at investing in it. The average monthly cell phone bill is $73, cable TV bill is $99, and internet bill is $47. Yet the average monthly water bill is only about $30. We can all easily imagine a day without our cell phone, cable TV, or internet; these items are luxuries. And yet we pay more for these services than we do for water. That is a sobering fact that needs to change, and soon.

water_loss_united_statesAccording to the Value of Water Coalition, the expected longevity of water and wastewater infrastructure is 50 years, yet the average age of these very pipes in Washington D.C. is 79 years. New England infrastructure is even older, much of it over 100 years old. Aging infrastructure accounts for 1.7 trillion gallons of lost water — water that has already been treated and is clean and ready for drinking — per year, which is the amount of water consumed by the top ten American cities annually. With 43% of our nation experiencing drought, and our demand rising due to population growth, this excessive water loss from failing pipes is crippling. The 1.7 trillion gallons of lost water comes at a staggering cost of $2.6 billion, which is about the amount of money that the federal government allots to water infrastructure annually.

age_united_states_water_infrastructureTo repair our nation’s water and wastewater infrastructure would require an investment of $4.8 trillion over the next 20 years. Yet infrastructure spending is actually down 30% since 2012. Add to that the degradation of our water supply through pollution and environmental damage, and it is clear why communities are struggling to simply meet drinking water standards and to maintain their aging infrastructure, never mind upgrade.

Hoping to share the value of our world’s most precious resource, the Value of Water Coalition conceptualized “Imagine a Day Without Water.” The inaugural event takes place October 6-8, 2015, and encourages everyone, from water suppliers to engineering firms to concerned citizens, to spread the word about the value of water. It’s easy to see that our transportation infrastructure needs investment; after all, hearing about bridge collapses and failing dams is cause for concern, and the American public demands repairs. But what about water? Again, we don’t see it, so we don’t think about it or talk about it. But if our water system failed, life as we know it would halt. Industry depends on water for manufacturing, agriculture requires irrigation, and we need water simply to go on living.

water_loss_united_statesThe time to invest in our nation’s water and wastewater infrastructure is now. Help spread the word about the value of water, and encourage friends and colleagues to try to imagine a day without water. With some smart investing, careful planning, education, conservation, and governmental support, the most we will need to do is imagine a day without water, not actually live it.

Coffee Day 2015: Coffee, the Environment, and Sustainability

national coffee day 2015This week, we celebrate coffee. Tuesday, September 29, is National Coffee Day, a beloved American holiday where coffee powerhouses such as Dunkin’ Donuts, Krispy Kreme, Peet’s, Starbucks, and Wawa offer freebies and discounts. As an added coffee bonus this year, the International Coffee Organisation (ICO) has designated October 1 as the first annual International Coffee Day. This special day will celebrate all things coffee and will be launched in Milan, Italy as part of the city’s 2015 World Fair.

Global Coffee Consumption

After only crude oil, coffee is the most sought commodity in the world, and is worth over $100 billion globally. Sugar, corn, natural gas, and even gold all take a back seat to coffee. The global population drinks over 500 billion cups of coffee every year and more than half of all Americans over the age of 18 drink coffee every single day. Coffee farms, 67% of which are in the Americas and 90% of which are in developing countries, provide the economic livelihood for over 25 million people. And while developing nations grow and produce the world’s coffee, industrialized nations drink it. After water, coffee is actually the most consumed beverage in the world. Finland drinks the most coffee per capita in the world, and America consumes the most coffee overall. Brazil, the top coffee producing nation in the world, ranks a distant 13th per capita consumer.

Environmental Impact

deforestation coffeeAs demand has increased, coffee producing countries have been responsible for a significant amount of global deforestation and watershed damage. Coffee was historically a shade-grown crop, intolerant of direct sunlight. Shade trees provide a habitat for birds that provide natural insect control, and they also enhance soil and encourage water retention in the soil, resulting in shade-grown coffee requiring little to no pesticides or fertilizers.

Unfortunately, only 24% of today’s coffee is actually shade-grown. Newer techniques that call for clear-cutting forests and applying chemicals have been found to greatly increase yields — but at great environmental and health cost. 60% of the six million acres of coffee lands have been completely stripped of shade trees since 1972, and coffee is now the third most pesticide-laden crop in the world, behind only tobacco and cotton. Bird populations have decreased by 20% in the last ten years alone, and soil erosion and depletion resulted in producers searching for new land on which to plant their coffee crops, and further deforestation, particularly of rainforests. Rainforests act as the world’s thermostat by regulating temperatures and weather patterns and are also critical in maintaining Earth’s finite supply of fresh water. Now understood to be unsustainable, this “new” method of growing coffee also damages watersheds and affects the health and livelihood of local populations.

algae_bloom
Excessive nitrogen or coffee wastewater from wet mills both contribute to algae blooms in coffee-growing nations

Because the land is clear-cut and coffee is typically grown in highlands, soil erosion and agrochemical runoff are major problems in coffee production. The excessive amount of pesticides and fertilizers needed to grow conventional coffee runs unhindered and unfiltered into lakes and streams downhill from the coffee shrubs. Very often, these lakes and streams are the main water supply for the local community. More and more frequently, water supplies in coffee-growing nations are becoming severely contaminated due to runoff from fertilizer, which adds nitrogen to the depleted soil, and, in turn, the local water. And since nitrogen is a vital nutrient for plants and encourages plant growth, it also encourages the growth of algae in bodies of water. Excessive algae in water bodies, called “blooms”, makes the water unfit for consumption and causes foul odors and tastes. When the algae finally dies and starts to decompose, it removes all oxygen from the water, causing ammonias to form, and results in the widespread die-off of fish and other aquatic organisms. Groundwater beneath coffee farms can also become contaminated with excess nitrogen, causing a health threat to humans.

Pesticide usage in coffee growing also contaminates water supplies. Whether entering the water supply through aerial spraying or from soil erosion and runoff, pesticides are known to be toxic to human and aquatic health. Many of the pesticides used in coffee growing nations have long been banned in the United States, and are known to bio-accumulate, disrupt hormones, and cause cancer.

Wet mill coffee processing uses an exorbitant amount of water and produces wastewater that can harm ecosystems in coffee-growing communities

And that’s just the growing. Add coffee harvesting and processing, and the outlook is grim. Conventional coffee is strip harvested, meaning all berries, ripe or not, are stripped off the vine, and sorted and depulped using a wet mill. Water-intensive mills, or wet mills, use water to sort and strip the beans of their mucilage, or protective coating. The beans are then allowed to ferment before they are washed, again utilizing an exorbitant amount of water, to ensure that all of the mucilage has been removed. Even small coffee mills utilize millions of gallons of water over a season, oftentimes depleting local water supplies and causing die-off of aquatic organisms. In addition, the wastewater produced by these wet mills contains nitrates, carbohydrates, proteins, fibers, fat, and many other substances, and these substances end up contaminating the local water supply. In fact, coffee wastewater is one of the largest contributors to water supply contamination in coffee-growing communities. Bacteria that break down the sugars and pectins in coffee wastewater require excessive oxygen, resulting in the same oxygen depletion and subsequent die-off caused by excessive nitrogen as described above. Many times, streams or other bodies of water contaminated in this way are effectively killed, requiring significant treatment that costs more than most of these communities can afford.

Sustainability

coffee_indonesia
A man hand strips coffee in Indonesia

Because of growing knowledge and concern over the detrimental environmental effects of coffee production, solutions have been increasing. Dry mills are one example. Dry mills utilize mechanical demucilagers, do not require fermentation or washing processes at all, and use less than three gallons of water per pound of dry coffee. For wet mills, a solution lies in wetland engineering. For example, TechnoServe and Mother Parkers Tea & Coffee have joined forces to install Vetiver grass wetlands at wet mills. These wetlands, which are a low-cost but sustainable wastewater treatment option, contain deep-rooted Vetiver grass that drinks in wastewater and slows infiltration. Any remaining effluent enters a small pond at the bottom of the wetland where it evaporates.

Table courtesy of Department of Wildlife Ecology and Conservation, University of Florida/IFAS Extension,

But there are still plenty of conventional coffee producers, simply because conventional coffee processes are cheaper. Therefore, some forward-thinking companies have taken it upon themselves to require better practices. Mega-coffee chain Starbucks, the third largest restaurant chain in the world, implemented one of the industry’s first sets of sustainability standards, called Coffee and Farmer Equity (C.A.F.E.) Practices. Verified by third-party experts, this set of standards is more stringent than even Organic Certification or Fair Trade Certification, and focuses on both environmentalism as well as social responsibility. Peet’s Coffee & Tea works with certification organizations such as Rainforest Alliance Certification and UTZ Certified — which is on par with Starbucks C.A.F.E. practices — to ensure that every bean they purchase is fair trade as well as sustainably grown. But the San Francisco Bay-based company takes it one step further: they roast all their beans in the nation’s first LEED Gold certified coffee roasting plant, opened in 2007. Other coffee certifications include 4C Certification and Smithsonian Migratory Bird Center’s Bird-Friendly Certification.

Conclusion

coffee loveCoffee is a beloved beverage, enjoyed worldwide throughout different cultures, but it has come under scrutiny for its negative environmental and humanitarian impact in recent years. There are ways to reduce and even remove the detrimental effects associated with coffee production, and some forward-thinking coffee companies have implemented buying standards in an effort to improve both our environment as well as the livelihood of coffee farmers, while many other small coffee companies sell only fair trade or organic coffees. This week, as we celebrate both National Coffee Day on Tuesday, September 29, and the first annual International Coffee Day on Thursday, October 1, we can choose to support coffee companies who grow responsibly, which means helping to protect our world’s most precious resource — water. Now that’s something to celebrate. Happy Coffee Week!

The Criticality of Energy Efficiency for Water and Wastewater Utilities

electricity meterMunicipal water and wastewater services require electricity, and lots of it. Drinking water and wastewater systems in the United States account for 3-4% of our nation’s total energy usage and add over 45 million tons of greenhouse gases to our environment each year. High energy costs for water and wastewater utilities are straining municipal budgets and creating unsustainable operating costs, and with prices already on the rise due to increasing regulations and demand, passing energy costs on to consumers simply isn’t a viable option. Drinking water and wastewater treatment plants account for 30-40% of the total energy consumed by municipal governments, making them the single largest energy consumers in the municipal sector. Add to that the fact that energy currently accounts for an average of 40% of operational costs for drinking water systems and is expected to increase to 60% within the next 15 years, and it becomes clear that energy efficiency for water and wastewater utilities is no longer a choice – it’s a necessity.

But it’s not all doom and gloom. Energy costs for water and wastewater utilities are indeed significant, but they also represent the largest controllable cost of providing water and wastewater services. Studies have estimated that 15-30% energy savings is readily achievable through cost-effective efficiency measures in water and wastewater plants, and that utilities can realize significant financial returns with a payback period from only a few months to about five years.

lightbulb water Very often, utilities can save substantially by increasing the efficiency of pumps and aeration equipment at water and wastewater treatment plants. In addition, operational changes such as proactively shifting energy usage away from peak demand times where electricity is most expensive, or generating electricity and heat from biogas, can greatly reduce energy usage. Water and wastewater utilities are not typically designed and operated with energy efficiency as a primary objective, as more pressing concerns such as regulatory requirements, capital expenditure, reliability, and securing funding typically take precedence. However, it is important not to overlook these systems when communities fund energy improvement projects, as significant energy and monetary savings can be realized through operational changes and capital improvement projects. And these savings make a big difference. Even a 10% energy reduction in our nation’s drinking water and wastewater systems would save about $400 million and five billion kWh annually, greatly reducing both the financial burden currently plaguing water and wastewater utilities as well as our impact on the environment.

But where to start? The first step towards making informed decisions that result in the highest return on investment (ROI) in the shortest amount of time is an energy audit. Since 2008, EPA has been actively working with water and wastewater utilities to help them become more efficient and to reduce operational costs, and one of the key steps in their process is an energy audit. A quality water and/or wastewater energy audit should focus on energy efficient equipment replacement, operational modifications, and process control that will lead to improved efficiency and cost savings with the shortest possible payback period, and includes processes such as conducting on-site observations, testing existing systems and equipment, monitoring power usage and costs, and developing strategies to limit demand charges.

Kachina, Arizona
Kachina, Arizona

As an example, Tata & Howard conducted an energy audit on the water production assets and distribution system of the Kachina Village Improvement District (KVID) in Arizona. During the course of the study, the well pumps and booster pumps were evaluated relative to their efficiency while the operational practices of the distribution system were reviewed. The results of the study indicated that the pump efficiencies ranged from 27% to 60%, and it was recommended that the KVID replace several low performing pumps. The cost of the upgrades was $136,000 and the project would be eligible for a $20,000 rebate from Arizona Public Service (APS). With the upgrades, KVID would save approximately $23,000 in annual power costs, resulting in a projected ten-year savings of $114,000 and a payback period of five years.

For new construction, it is imperative to choose a design firm with clear experience in designing energy efficient projects, as the design phase is the absolute best time to think about energy efficiency as well as renewable energy options. A plant that is designed with energy efficiency and renewable energy from the beginning has the potential to actually produce more energy than it uses.

Allocating the resources and time to conduct an energy audit and implement the required capital improvements and operational changes can produce significant benefits. Energy audits can pinpoint the most energy-consuming equipment, detect issues with aging equipment, and expose operational issues, as well as determine which upgrades would result in the best ROI. The result is a well-defined, defendable plan of action that will result in optimal energy savings.

www.epa.gov
www.esmap.org
www.nrel.gov
www.ase.org
www.mass.gov

SaveSave

SaveSave

5 family-friendly water and wastewater field trips in New England

Summer is here, and with it comes long, lazy days, school vacation, and, of course, family trips. When the beaches, amusement parks, and movie theaters start to get stale, why not take a water or wastewater field trip to explore the inner workings of our nation’s water and wastewater infrastructure? We’ve assembled five excellent water and wastewater field trips that are right here in beautiful New England. These trips provide STEM (Science, Math, Engineering, and Technology) education while also being engaging and fascinating. And these trips aren’t just for budding engineers. Half of all STEM jobs do not require a college degree and pay higher than non-STEM jobs with similar educational requirements.

Top 5 Family-Friendly Water and Wastewater Field Trips in New England

deer_island_wastewater
Deer Island Wastewater Treatment Plant

1. Deer Island Wastewater Treatment Plant, Boston, MA — Operated by the Massachusetts Water Resource Authority (MWRA)

The MWRA offers tours of its Deer Island Wastewater Treatment Plant on Tuesdays and Fridays from April through November. All tours begin at 9:30 a.m. and are open to adults and kids in grades 7+. But the treatment facility isn’t the only attraction at Deer Island. With 60 acres of natural open space, Deer Island offers plenty to do for the entire family, including five miles of public walkways and trails for strolling, jogging, sightseeing, picnicking, fishing, and cycling. There are ten landscaped overlooks with sweeping views of the Boston skyline and islands, handicapped accessible paths, and low impact development (LID) features including low-maintenance, native plant species. The public access area is open year-round, from sunrise to sunset. https://www.mwra.com/03sewer/html/sewdi_access.htm

Waterworks Museum, Boston, MA

2. Waterworks Museum, Boston, MA

The Waterworks Museum is located on the site of the original Chestnut Hill reservoir and pumping station and provides regional information on clean water, health, engineers, and architecture. In addition to providing the history of waterworks in the City of Boston, the museum’s Great Engines Hall houses three historic, steam-powered pumping engines, and walking tours of the reservoir itself are available. The architecturally breathtaking museum is open Wednesday – Sunday from 11am-4pm year-round, with extended “Waterworks Wednesday” hours until 9pm from April through November. Waterworks Wednesdays feature authors, concerts, and guest speakers in addition to regular tours and learning opportunities. https://waterworksmuseum.org

Ben & Jerry's "Chunkinator" converts ice cream waste into energy
Ben & Jerry’s “Chunkinator” converts ice cream waste into energy

3. Ben & Jerry’s, Waterbury, VT

From its humble beginnings in a warehouse in Burlington, VT, Ben & Jerry’s has grown to a highly successful global corporation. And while the company has exponentially increased in both size and reach, it has remained loyal to its local roots. So when it was determined that the waste created in their Waterbury, Vermont location would overload the local wastewater treatment facility, they instead decided to funnel it to two of their local dairies where it is processed in a methane digester along with other farm waste. The result? Enough biomass energy to power the farms. Unfortunately, tours of the methane digester are not available. But that’s OK, because Ben & Jerry’s offers tours of its ice cream manufacturing facility, and these tours include education on the dairy waste – as well as ice cream samples. https://www.benjerry.com/about-us/factory-tours

BONUS: Building on their commitment to green energy, Ben & Jerry’s is the first ice cream company in the world to power one of its manufacturing plants using its own waste. Located in Hellendoorn, Netherlands, the “Chunkinator” is a BIOPAQ®AFR Biodigester containing over 24 billion natural micro-organisms that turn the plant’s own ice cream waste and wastewater into biogas that fuels the plant. To date, the brightly-painted Chunkinator has produced enough power to make over 16 million pints of Ben & Jerry’s ice cream. So if you happen to be in the Netherlands this summer, be sure to swing by to check it out! https://brightfuture.unilever.com/stories/423955/THE-CHUNKINATOR–Turning-ice-cream-into-energy.aspx

Maine's stunning Sebago Lake offers something for everyone
Maine’s stunning Sebago Lake offers something for everyone

4. Sebago Lake Water Treatment Facility, Standish, ME

Maine’s Sebago Lake Region is a popular summer destination that offers camping, fishing, boating, hiking, shopping, dining, live music, theatre, and much more, and families travel from all over the country to enjoy the region’s pristine, natural beauty. While you are there, you can add a little education into the family trip by visiting the Portland Water District’s Sebago Lake Water Treatment Facility. Tours are available on the first and third Thursdays of each month, beginning at 9:30am and lasting approximately two hours, and include both the facility and the lab. Due to the technical, complex nature presented, tours are recommended for high school age and older. Located on a 10-acre site in Standish, Maine, the state-of-the-art facility utilizes screening, ozonation, UV light treatment, chloramination, fluoridation, and corrosion control. https://www.pwd.org/tours

After visiting the Stamford Water Pollution Control Authority, be sure to stop by beautiful Cove Island Park

5. Stamford Water Pollution Control Authority (WCPA), Stamford, CT

The Stamford Water Pollution Control Facility processes wastewater from Stamford and Darien, CT and discharges the treated water into the Stamford Harbor. The site has been treating wastewater since 1900, with the first plant being built in 1943. Upgraded in 1976 and again in 2006, the facility is manned 24/7/365. In response to multiple requests for tours, WPCA began offering regular public tours in 2013. Held on the second Friday of each month at 12:30pm (weather permitting), the tour includes classroom education on the wastewater treatment process followed by a walking tour of the plant to see it in full operation. Total tour time is approximately one and a half hours. In addition, comprehensive student or group educational tours for all ages can be scheduled in advance for Monday through Friday between the hours of 8am and 3pm. https://www.stamfordwpca.org/public-outreach.aspx

BONUS: While visiting Stamford, families can also visit Cove Island Park, a beautiful 83-acre beach and park on Long Island Sound that offers plenty of space for walking, biking, picnicking, or swimming, or they can even catch a ferry over to New York City.

Summer in New England is simply perfect for day tripping, and the education provided by a water or wastewater treatment plant tour is invaluable. So check out one (or more) of these five water and wastewater field trips, and let us know what you think. Happy summer!

Ribbon Cutting on New $4.1 Million Wastewater Treatment Plant in Canaan, VT

l to r: April Hyde, Chief Operator, Town of Canaan; Greg Noyes, Canaan VT Board Member; Chris Hebert, Project Manager, The General Contractor - Daniel Hebert, Inc.; Gary Leach, P.E., Vice President, The Engineer - Tata & Howard, Inc.; Noreen Labrecque, Canaan VT Town Clerk; Ted Brady, State Director, The Funding Agency - USDA; Rita Hibbard, Stewartstown NH Town Clerk; Hasen Burns, Stewartstown NH Board Member
l to r: April Hyde, Chief Operator, Town of Canaan; Greg Noyes, Canaan VT Board Member; Chris Hebert, Project Manager, The General Contractor – Daniel Hebert, Inc.; Gary Leach, P.E., Vice President, The Engineer – Tata & Howard, Inc.; Noreen Labrecque, Canaan VT Town Clerk; Ted Brady, State Director, The Funding Agency – USDA; Rita Hibbard, Stewartstown NH Town Clerk; Hasen Burns, Stewartstown NH Board Member

The towns of Canaan, VT and Stewartstown, NH celebrated the completion of their shared $4.1 million wastewater treatment plant with a ribbon-cutting ceremony on Thursday, June 25, in Canaan. The total cost of the facility improvements was $4.12 million and the towns received $2.41 million in grant money as well as a $1.69 million low interest loan from the U.S. Department of Agriculture (USDA) Rural Development. The new system replaces a decades-old facility that was costly to operate and did not meet state and federal water quality standards.

Tata & Howard, Inc. provided complete consulting engineering services for the design and construction of the wastewater treatment facility project that consisted of a complete upgrade of four pump stations and the 0.185-MGD, 3-cell lagoon wastewater treatment facility. The upgrades provide the towns with a state-of-the-art, reliable wastewater treatment facility that meets stringent Effluent Discharge limits to the Connecticut River and allows for a more efficient treatment process. The new influent screening and grit removal processes extend the life of the treatment facility components, and septage receiving allows for additional income and also provides service to the other residents of the town that are not on public sewer. The design incorporated numerous energy efficient features, including variable-frequency drives on all motors and aeration blowers, a wood pellet boiler for heat, energy efficient windows, and insulated concrete block walls, resulting in a reduction in annual operation and maintenance costs. The pump stations were upgraded to eliminate the operator from entering below grade structures and allow for low-cost future replacement.

Tata & Howard Raises Funds for Camp Sunshine

Tata & Howard Raises Funds for Camp Sunshine

flip flop day camp sunshine
Collin Stuart, Heidi White, Brooke Cotta, Marie Rivers, Molly Coughlin, Amanda Cavaliere, Karen Gracey, Brittany Colcord, Jenna Rzasa, and Matt St. Pierre pose with their flip flops

New England-based engineering firm participates in National Flip Flop Day to support Maine camp

Employee-owners from Tata & Howard, Inc., a leading innovator in water, wastewater, stormwater, and environmental services engineering solutions, participated in National Flip Flop Day on June 19th. The holiday, which falls on the third Friday in June each year, was started nine years ago by Tropical Smoothie Café in order to raise funds to benefit Camp Sunshine, a retreat in Maine for children with life-threatening illnesses and their families.

Tata & Howard team members participated in their own version of National Flip Flop Day in which employee-owners were able to wear flip flops to work in exchange for a donation to Camp Sunshine. 100% of donations were matched by Tata & Howard’s Philanthropy Committee.

“With offices throughout New England, Tata & Howard is committed to finding ways to give back to the community in which we live and work,” said Jenna Rzasa, P.E., Vice President of Tata & Howard. “Maine’s Camp Sunshine provides both solace and joy to severely ill children and their families, and we are deeply honored to support their efforts.”

Located in beautiful Casco, Maine, Camp Sunshine is the only organization in the nation that focuses on not only addressing the effects of a life-threatening illness on the child who is ill, but also the entire family. Surrounded by professional staff within the breathtaking grounds of Camp Sunshine, families receive a reprieve from the stress of having a child with an illness and spend a week just having fun together.

To date, National Flip Flop Day has raised over $2 million for Camp Sunshine.

Effective Water and Wastewater Utility Management

A water main break is a common occurrence with our nation’s failing infrastructure

As water and wastewater utilities nationwide face an increasing number of challenges, including rising costs and population, aging infrastructure, drought, increasingly stringent regulatory requirements, and a rapidly changing workforce, creative and innovative methodologies for treatment and distribution along with efficient and effective utility management have become paramount. In order to ensure a strong and viable utility for future generations, utilities must find ways to improve their products and services while increasing community support. Effective water and wastewater utility management helps utilities improve performance in critical areas while responding to current and future challenges, all with limited infrastructure dollars.

In May of 2007, six major water and wastewater associations and the U.S. Environmental Protection Agency signed an historic agreement pledging to support effective utility management collectively and individually throughout the water sector and to develop a joint strategy to identify, encourage, and recognize excellence in water and wastewater utility management. Participating organizations included the following:

  • Association of Metropolitan Water Agencies (AMWA)
  • American Public Works Association (APWA)
  • American Water Works Association (AWWA)
  • National Association of Clean Water Agencies (NACWA)
  • National Association of Water Companies (NAWC)
  • United States Environmental Protection Agency (EPA)
  • Water Environment Federation (WEF)

The result of this powerhouse collaboration was the Effective Utility Management Primer, issued in June of 2008. The Primer, designed specifically to assist water and wastewater managers in identifying and addressing their most urgent needs through a customized, incremental approach, outlines ten attributes of effectively managed utilities along with five keys to management success:

Ten Attributes of Effectively Managed Water Sector Utilities

  1. Effective Utility Management: A Primer for Water and WastewaterProduct Quality produces potable water, treated effluent, and process residuals in full compliance with regulatory and reliability requirements and consistent with customer, public health, and ecological needs.
  2. Customer Satisfaction provides reliable, responsive, and affordable services in line with explicit, customer- accepted service levels. Receives timely customer feedback to maintain responsiveness to customer needs and emergencies.
  3. Employee and Leadership Development recruits and retains a workforce that is competent, motivated, adaptive, and safe-working. Establishes a participatory, collaborative organization dedicated to continual learning and improvement. Ensures employee institutional knowledge is retained and improved upon over time. Provides a focus on and emphasizes opportunities for professional and leadership development and strives to create an integrated and well-coordinated senior leadership team.
  4. Operational Optimization ensures ongoing, timely, cost-effective, reliable, and sustainable performance improvements in all facets of its operations. Minimizes resource use, loss, and impacts from day-to-day operations. Maintains awareness of information and operational technology developments to anticipate and support timely adoption of improvements.
  5. Financial Viability understands the full life-cycle cost of the utility and establishes and maintains an effective balance between long-term debt, asset values, operations and maintenance expenditures, and operating revenues. Establishes predictable rates—consistent with community expectations and acceptability—adequate to recover costs, provide for reserves, maintain support from bond rating agencies, and plan and invest for future needs.
  6. Infrastructure Stability understands the condition of and costs associated with critical infrastructure assets. Maintains and enhances the condition of all assets over the long-term at the lowest possible life-cycle cost and acceptable risk consistent with customer, community, and regulator-supported service levels, and consistent with anticipated growth and system reliability goals. Assures asset repair, rehabilitation, and replacement efforts are coordinated within the community to minimize disruptions and other negative consequences.
  7. Operational Resiliency ensures utility leadership and staff work together to anticipate and avoid problems. Proactively identifies, assesses, establishes tolerance levels for, and effectively manages a full range of business risks (including legal, regulatory, financial, environmental, safety, security, and natural disaster-related) in a proactive way consistent with industry trends and system reliability goals.
  8. Community Sustainability is explicitly cognizant of and attentive to the impacts its decisions have on current and long-term future community and watershed health and welfare. Manages operations, infrastructure, and investments to protect, restore, and enhance the natural environment; efficiently uses water and energy resources; promotes economic vitality; and engenders overall community improvement. Explicitly considers a variety of pollution prevention, watershed, and source water protection approaches as part of an overall strategy to maintain and enhance ecological and community sustainability.
  9. Water Resource Adequacy ensures water availability consistent with current and future customer needs through long-term resource supply and demand analysis, conservation, and public education. Explicitly considers its role in water availability and manages operations to provide for long-term aquifer and surface water sustainability and replenishment.
  10. Stakeholder Understanding and Support engenders understanding and support from oversight bodies, community and watershed interests, and regulatory bodies for service levels, rate structures, operating budgets, capital improvement programs, and risk management decisions. Actively involves stakeholders in the decisions that will affect them.

Five Keys to Management Success

  1. water_utility_leadershipLeadership
    Leadership is critical to effective utility management, particularly in the context of driving and inspiring change within an organization. Leadership refers both to individuals who can be effective champions for improvement, and to teams that provide resilient, day-to-day management continuity and direction. Effective leadership ensures that the utility’s direction is understood, embraced, and followed on an ongoing basis throughout the management cycle.
  2. Strategic Business Planning
    Strategic business planning is an important tool for achieving balance and cohesion across the Attributes. A strategic plan provides a framework for decision making by assessing current conditions, strengths and weaknesses; assessing underlying causes and effects; and establishing vision, objectives, and strategies. It establishes specific implementation steps that will move a utility from its current level of performance to achieving its vision.
  3. Organizational Approaches
    There are a variety of organizational approaches that contribute to overall effective utility management and that are critical to the success of management improvement efforts, including actively engaging employees in improvement efforts; deploying an explicit change management process that anticipates and plans for change and encourages staff at all levels to embrace change; and utilizing implementation strategies that seek, identify, and celebrate victories.
  4. Measurement
    Measurement is critical to management improvement efforts and is the backbone of successful continual improvement management and strategic business planning. A measurement system serves many vital purposes, including focusing attention on key issues, clarifying expectations, facilitating decision making, and, most importantly, learning and improving.
  5. Continual Improvement Management Framework
    A continual improvement management framework can help utilities understand improvement opportunities and establish explicit service levels, guide investment and operational decisions, form the basis for ongoing measurement, and provide the ability to communicate clearly with customers and key stakeholders. This framework plays a central role in effective utility management and is critical to making progress.

OK – Now What?

business_overwhelmedSo how does a utility assess, address, and implement these changes? The primer further recommended an assessment tool with five steps, for which the instructions comprise the latter 35 pages of the Effective Utility Management Primer. Admittedly, the entire process requires dedicated time and personnel commitment from the utility. While some utility managers have had success in applying the assessment to their utility, many have found the process to require resources simply unavailable to them. Tata & Howard has developed two proprietary innovations that assist water and wastewater utilities in the identification of their most urgent needs as well as effective and efficient utility management.

Business Practice Evaluations

Business Practice Evaluations (BPEs) assess the health of a utility’s work practices by implementing a framework for a structured approach to managing, operating, and maintaining in a more business-like manner. This assessment provides the information and planning required by the Primer, specifically in the Five Keys to Management Success. A BPE’s primary focus is on effective management.

The overall goal of the assessment process is more efficient and effective work practices, and the assessment process and tools developed enable utility managers to assess the efficiency and effectiveness of the utility in comparison to generally accepted industry standards. The assessment includes documentation of current business practices, identification of opportunities for improvement, conducting interviews including a diagonal slice of the organization, and observation of work practices in the field. From this assessment we make recommendations to improve system performance, and the structured approach is fully customized and includes all functions of the utility — from administration and technical to operations and maintenance. The assessment process allows utility executives to proactively develop system specific plans, programs, and timelines to optimize the overall utility system programs.

Capital Efficiency Plans™

capitalWhere BPEs focus on management, Capital Efficiency Plans™ (CEPs) address the utility itself, combining the concepts of hydraulic modeling, system criticality, and asset management into a single comprehensive report. Each report is customized to the individual utility system and provides utilities with a database and Geographic Information System (GIS) representation for each pipe segment within their underground piping system. The CEP report also prioritizes system piping improvements and provides estimated costs for replacement and rehabilitation.

Each water and wastewater system has unique characteristics and challenges that are discussed at our CEP workshop held with knowledgeable field staff and managers for each project. The workshops provide significant value by filling in data gaps, correcting incorrect records, and identifying specific issues and critical components that are custom to the system. Our completed studies have been well received by many utilities who have found our methodology not only practical and understandable, but also defendable when justifying projects and procuring funding.

In Conclusion

Water and wastewater utilities today are finding themselves increasingly burdened with decreased revenue, excessive demand, and crumbling infrastrucure. Strict new regulations and a changing workforce have also added to the challenge, and it is imperative that water and wastewater utilities find ways to efficiently and effectively improve systems while implementing successful management strategies. Targeted assessments, strategic planning, and identification and implementation of best practices will be the foundation of all successful utilities in the future.